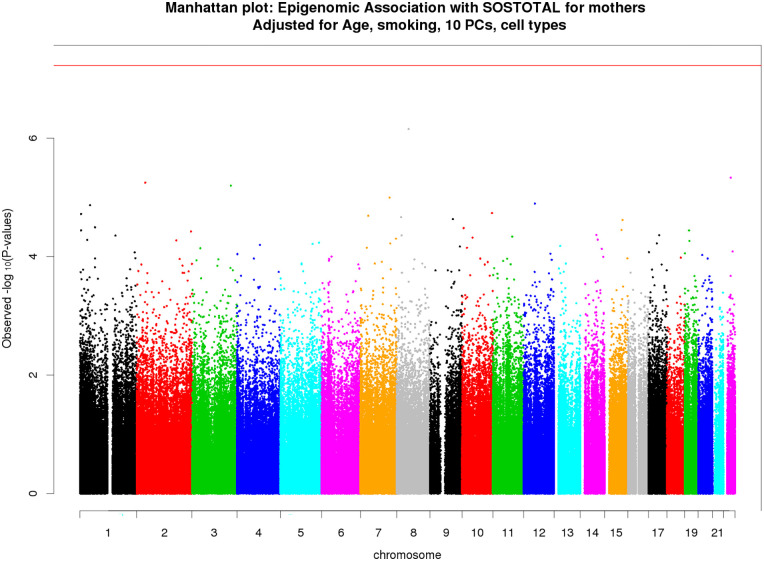
Figure 2.
Manhattan plot of epigenome-wide associations with self-reported stress for mothers. Associations of DNAm level at each CpG site with total stress score was tested using linear mixed model adjusted for age, smoking, cell-type proportions and top 10 principal components. The total sample size is n = 228. −log10(p) of each CpG site is plotted against its genomic position (hg19). Red line indicates the P-value cutoff for epigenome-wide significance.

