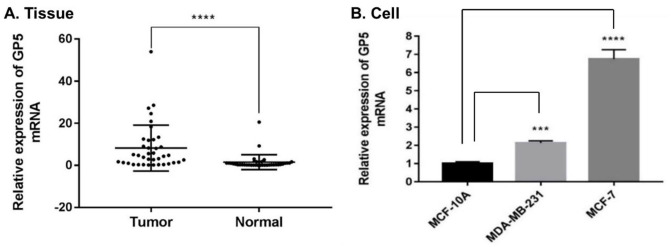
Figure 1.
The expression of GP5 mRNA in breast cancer tissue and cell compared with the normal group. Differences between groups were assessed using the chi-square analysis, and P values were indicated. (A) The expression level of GP5 mRNA in breast tumor tissues (n = 41) was 8.195 ± 10.903, and the expression level in normal (paracancerous) tissues (n = 41) was 1.480 ± 3.541. (B) The expression of GP5 mRNA in breast cancer cells (MCF-7 and MDA-MB-231) versus normal breast cells (MCF-10A).
****P < 0.001 in (A).
***P < 0.001; ****P < 0.0001 in (B).

