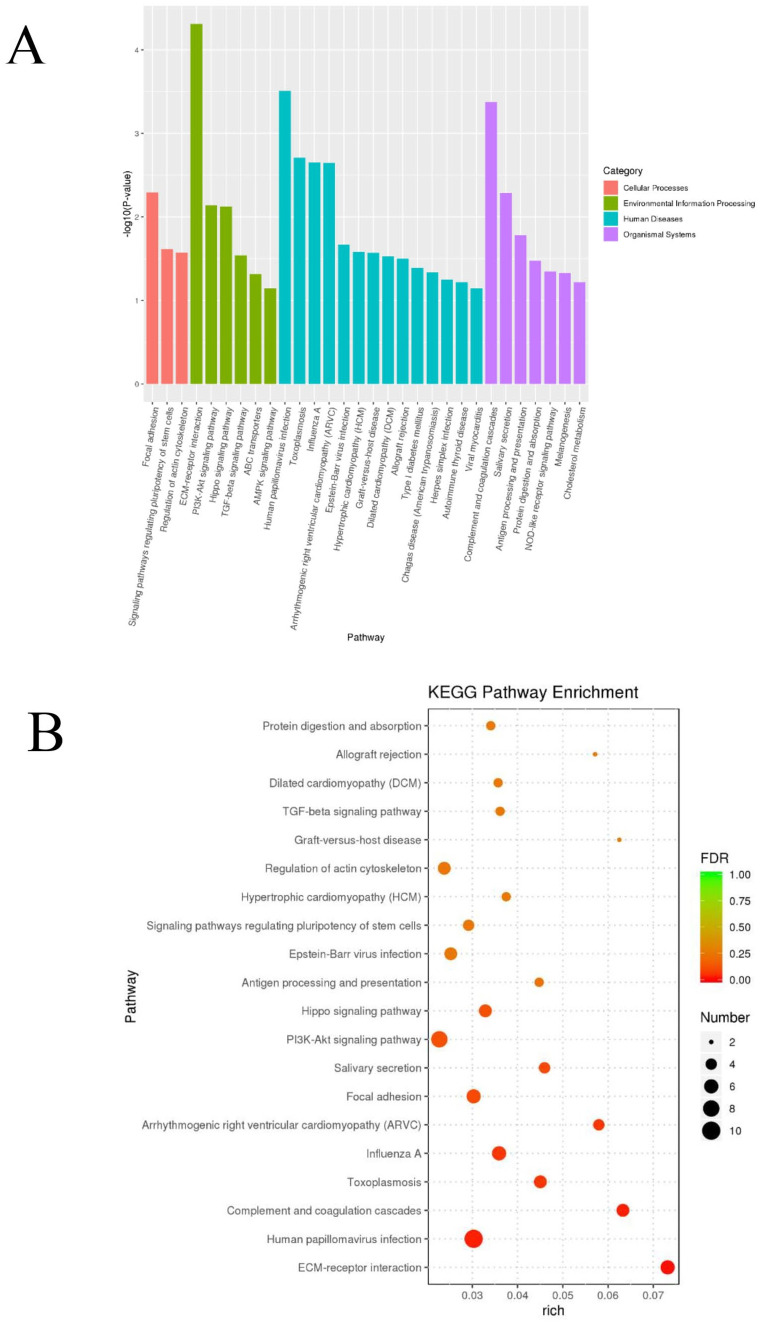
Figure 11.
KEGG pathway enrichment analyses of the differentially expressed genes. The histogram graph of the KEGG pathway enrichment results were showed according to P value (A). Bubble plots showing the top 20 significant results by false discovery rate (FDR) (B). (A color version of this figure is available in the online journal.)

