Figure 2.
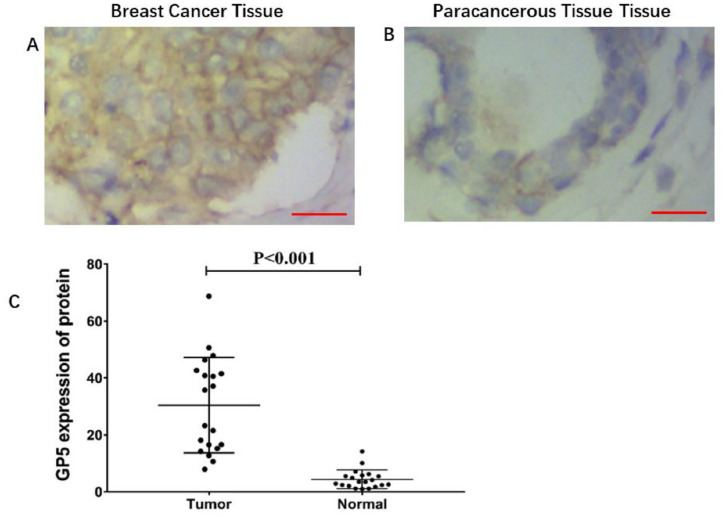
The expression level of GP5 protein in breast cancer and paracancerous tissue. (A) and (B) IHC (200×) analysis of GP5 protein expression in breast tumor and paracancerous tissue. Brown color represents the positive staining. Scale bar is 20 µm (A and B). (C) The expression level of GP5 protein in breast cancer tissue (n = 20) was 30.468 ± 16.806 and in normal tissue (n = 20) was 4.421 ± 3.286, P < 0.001.

