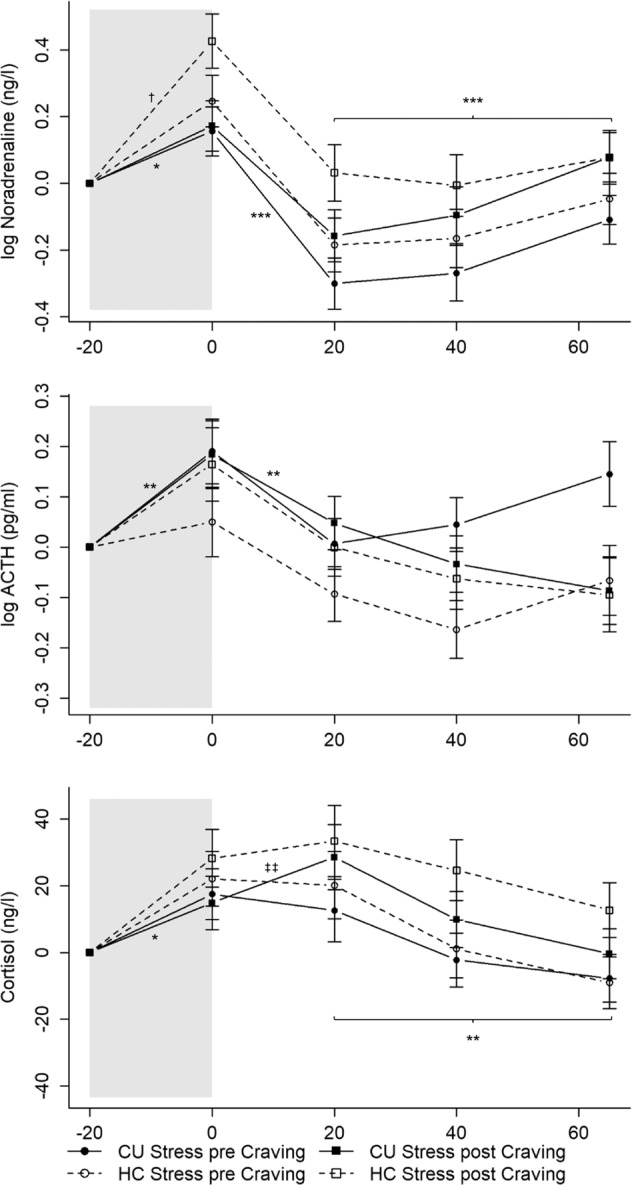
Fig. 2. Mean levels and standard errors of the mean for noradrenaline, ACTH, and cortisol during the TSST.

Gray shaded areas indicate the TSST. Values were normalized by subtracting the stress levels measured at T1 (−20 min) from all other values to facilitate interpretation of the stress reaction independently of effects of the circadian rhythm or baseline differences (T0). Cocaine users and healthy controls showed similar and significant increases in cortisol, ACTH, and noradrenaline with cocaine users undergoing the TSST after the Cocaine-Cue-Video demonstrating a stronger cortisol reaction. CU Cocaine users, HC Healthy controls. CU Stress pre Craving: *p < 0.05; **p < 0.01; ***p < 0.001; CU Stress pre Craving vs. HC Stress post Craving: †p < 0.05; CU Stress pre Craving vs. CU Stress post Craving: ‡‡p < 0.01. CU Stress pre Craving: n = 22; CU Stress post Craving: n = 20; HC Stress pre Craving: n = 19; HC Stress post Craving: n = 17.
