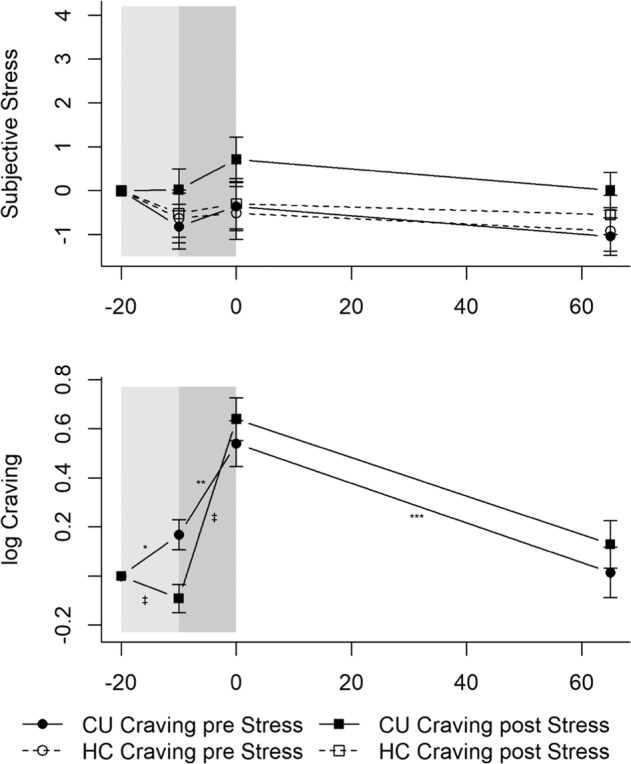
Fig. 4. Mean levels and standard errors of the mean for subjective stress and craving during the Cocaine-Cue-Video.

Gray shaded areas indicate the Cocaine-Cue-Video. Values were normalized by subtracting the levels measured at T1 (−20 min) from all other values to facilitate interpretation of the stress and craving reaction independently of effects of the circadian rhythm or baseline differences (T0). The Cocaine-Cue-Video did not induce a subjective stress response but elicited craving with cocaine users that underwent the Cocaine-Cue-Video after the TSST showing an enhanced craving response. CU Cocaine users, HC Healthy controls. CU Craving pre Stress: *p < 0.05; **p < 0.01; ***p < 0.001; CU Craving pre Stress vs. CU Craving post Stress: ‡p < 0.05. CU Craving pre Stress: n = 22; CU Craving post Stress: n = 25; HC Craving pre Stress: n = 18; HC Craving post Stress: n = 20.
