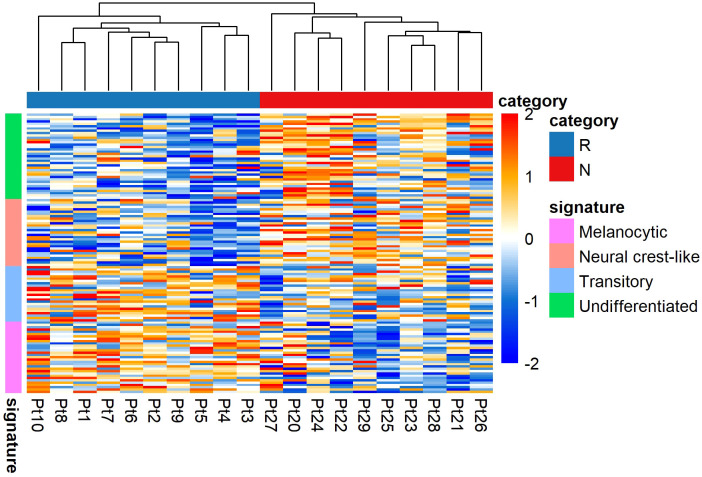
Figure 5.
Transcriptomic states of responding (n = 10) versus non-responding (n = 10) melanomas. The non-responder group of melanomas exhibited undifferentiated and neural crest-like gene expression signatures. In contrast, the responder group of melanomas mainly exhibited melanocytic and transitory gene expression signatures. Values are in z-score. Here, Pt, patient; R, responder; N, non-responder.

