
Figure 3.
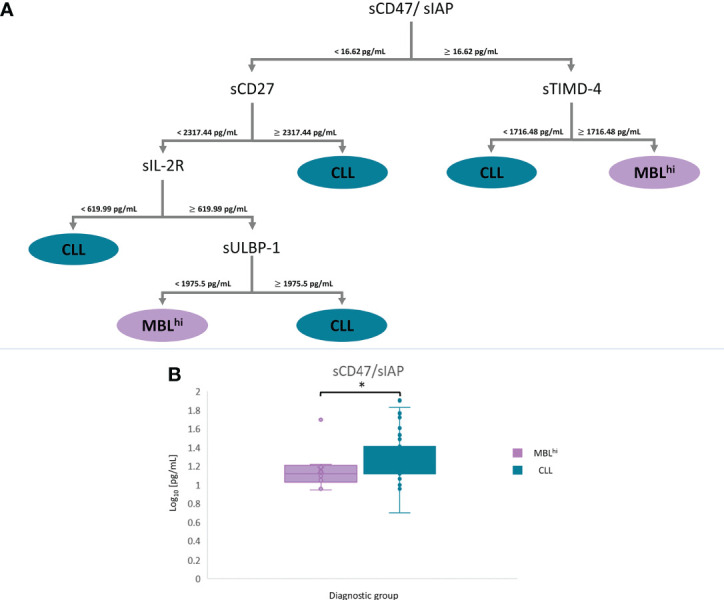
mRMR analysis: MBLhi vs. CLL. (A) Distribution and classification of MBLhi and CLL patients from quantitative soluble immune checkpoints and cytokines in serum. (B) Boxplot sCD47 in serum between MBLhi and CLL (*p – value< 0.05).
Official websites use .gov
A
.gov website belongs to an official
government organization in the United States.
Secure .gov websites use HTTPS
A lock (
) or https:// means you've safely
connected to the .gov website. Share sensitive
information only on official, secure websites.
mRMR analysis: MBLhi vs. CLL. (A) Distribution and classification of MBLhi and CLL patients from quantitative soluble immune checkpoints and cytokines in serum. (B) Boxplot sCD47 in serum between MBLhi and CLL (*p – value< 0.05).