Figure 5.

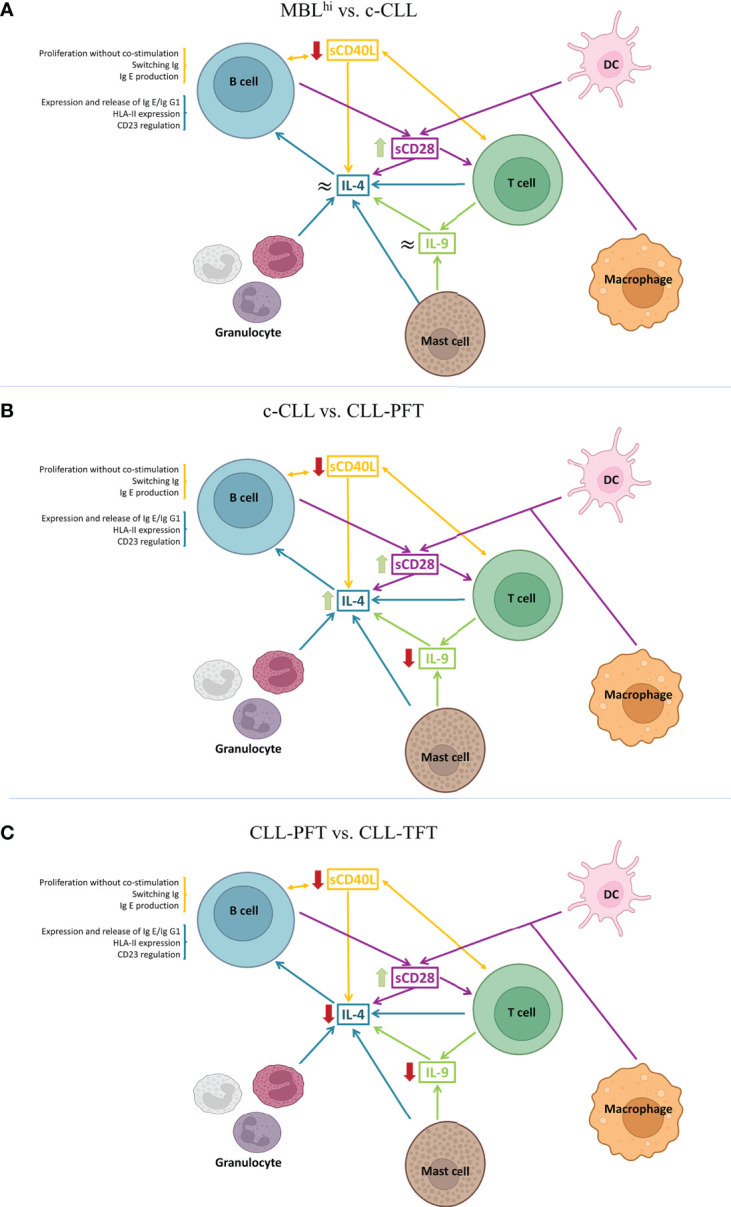
Schematic models of the TME from the role of the observed differential serum profiles. (A) MBLhi vs. c-CLL (stable and progression). (B) c-CLL vs. CLL-PFT. (C) CLL-PFT vs. CLL-TFT. (Created in Biorender.com)

Schematic models of the TME from the role of the observed differential serum profiles. (A) MBLhi vs. c-CLL (stable and progression). (B) c-CLL vs. CLL-PFT. (C) CLL-PFT vs. CLL-TFT. (Created in Biorender.com)