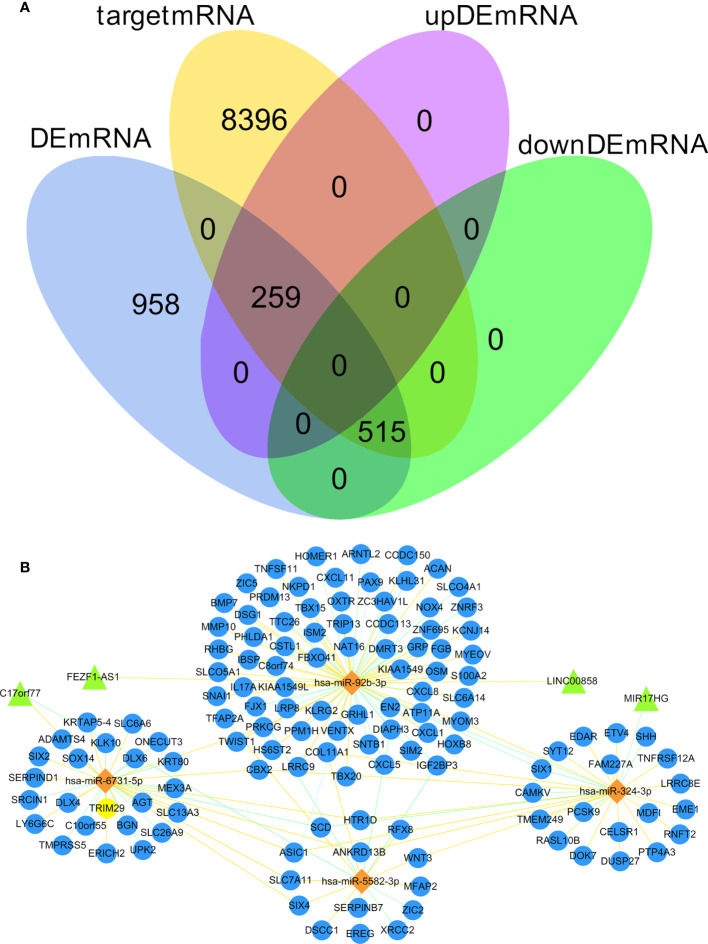
Figure 2.
Venn diagram of gene interactions and ceRNA network. (A) In the 774 differentially expressed target genes, 259 were up-regulated and 515 down-regulated. The yellow circle represents 9170 target mRNA, the blue circle represents 1732 DEmRNA, the pink circle represents 259 up-regulated differentially expressed target genes, and the green circle represents 515 down-regulated differentially expressed target genes. (B) The ceRNA network in CC. Triangles denote lncRNA, diamonds denote miRNA, and circles denote mRNA.

