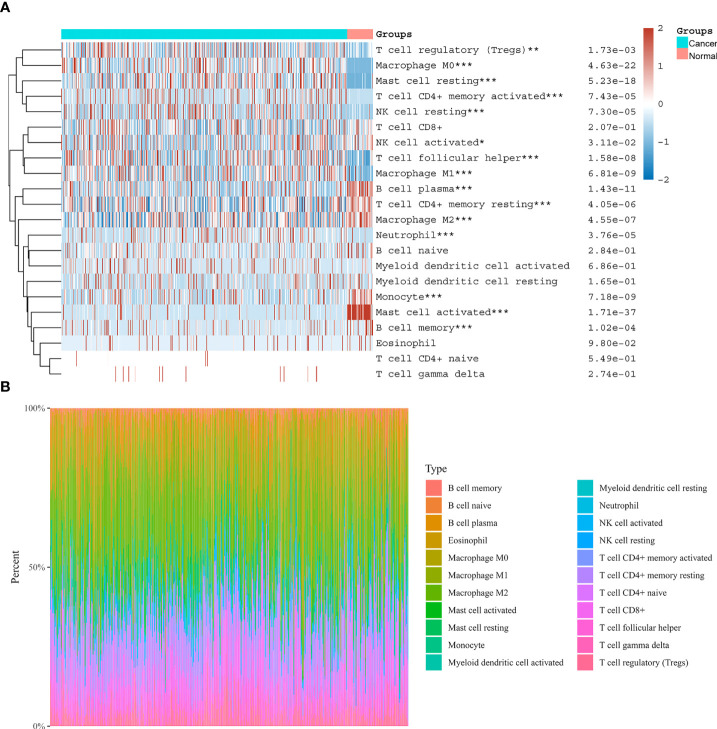
Figure 8.
Distribution of immune cells in CC and normal colon tissues. (A) Heatmap of immune cell scores. Abscissa represents different groups, ordinate represents immune cell types. Cancer represents CC tissues, Normal represents normal colon tissues. (B) The proportion of tumor infiltrating immune cells in each CC sample by the CIBERSORT algorithm. Different colors represent different immune cell types. The horizontal axis represents samples, and the vertical axis represents the percentage of each immune cell in each sample. *P < 0.05, **P < 0.01, ***P < 0.001.

