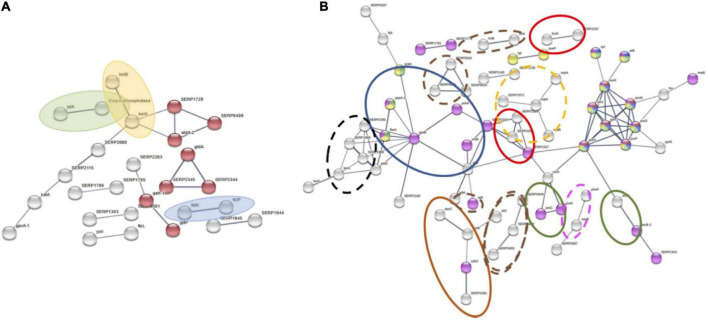
FIGURE 4.
STRING network of differentially abundant proteins between N55 and N77 conditions. Proteins increased (A) and decreased (B) in condition N55 when compared with N77. (A) Proteins associated with glycerolipid metabolism are represented as red nodes. Blue, yellow and green shadowed ellipsis highlight proteins involved in folate and betaine biosynthesis and phosphate metabolism. (B) Proteins associated to purine and nucleotide metabolism are represented as red, purple, green and yellow nodes, while those associated with the biosynthesis of secondary metabolites are represented as pink nodes, including proteins involved in glycolysis/gluconeogenesis/pyruvate metabolism, oxidative phosphorylation, acetoin catabolism arginine and proline metabolism circled by blue, orange, red and green open ellipsis. The other clusters highlighted with dashed black, brown, yellow and magenta ellipsis are the phosphoenolpyruvate:sugar phosphotransferase system (PTS), membrane transporters, extracellular proteases and the SaeRS two-component signal transduction system (TCS).

