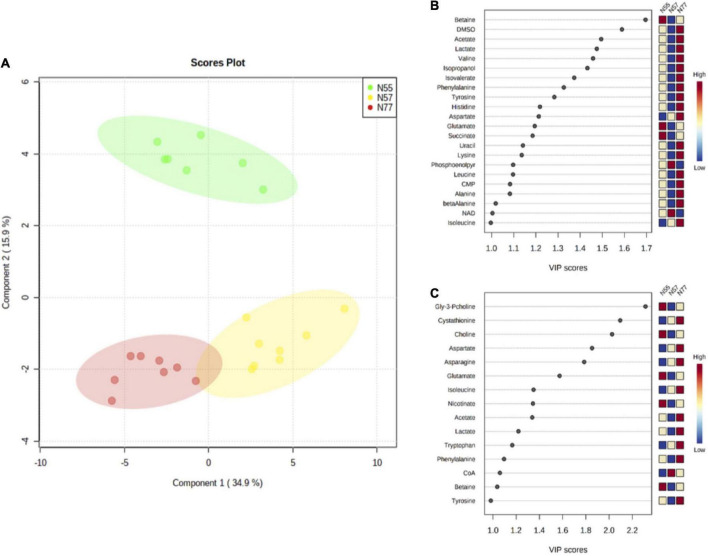
FIGURE 5.
PLS-DA model based on metabolites concentrations for the three pH conditions. (A) PLS-DA scores plot of first and second component, showing the discrimination between the 3 experimental conditions, N55 (green) N57 (yellow), and N77 (red) (with 5 components: R2 = 0.97 and Q2 = 0.92) using the metabolites levels. Metabolites that most contribute for the separation of the groups based on its VIP scores (>1) for (B) the first component and, (C) the second component; the colour scale presents the metabolite relative levels among the three experimental conditions.

