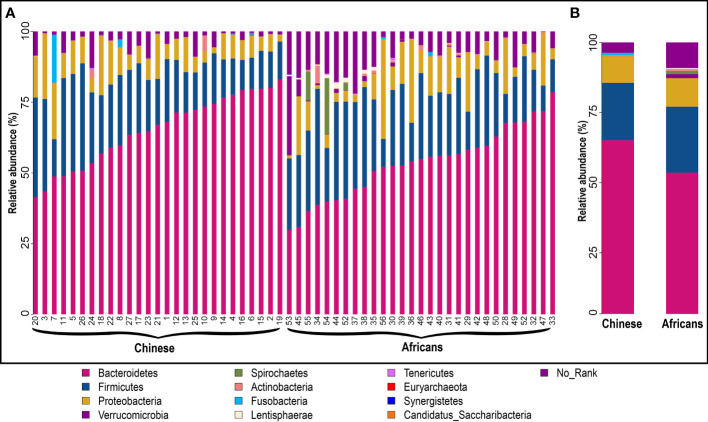
Figure 2.
Structural composition of gut microbiota community in the two groups. Microbial composition and their relative abundance in each sample (A) and between groups (B) at phylum level. The taxa with relative abundance ≥1% are presented. The remaining unmapped taxa are grouped as “No_Rank.” Each bar denotes a single sample or group, and each color represents the relative abundance in percentage for each OTU.

