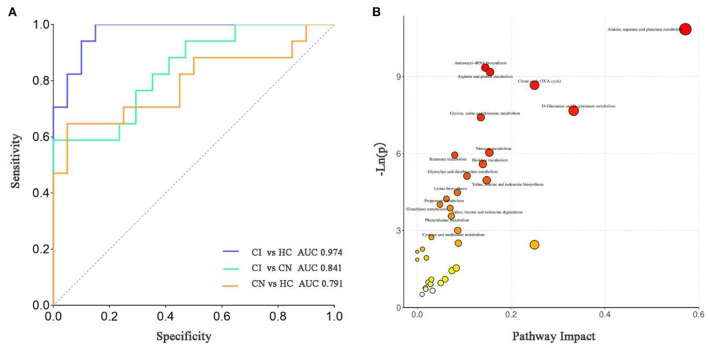
Figure 4.
(A) The ROC diagnostic analysis of biomarker panel (Imidazolepropionic acid, Erythronic acid, Homoserine, and Aspartic acid) for different groups. (B) Pathway analysis bubble plot by the Hsa set in KEGG. The x-axis is the pathway impact, indicating the importance of differentially expressed metabolites in metabolic pathways. The y-axis is the negative logarithm of p-value. The size of pathway symbols represents the statistical significance level of pathway analysis. The color of pathway symbols represents the impact factor. Large sizes and dark colors represent central pathway enrichment and high pathway impact values, respectively.

