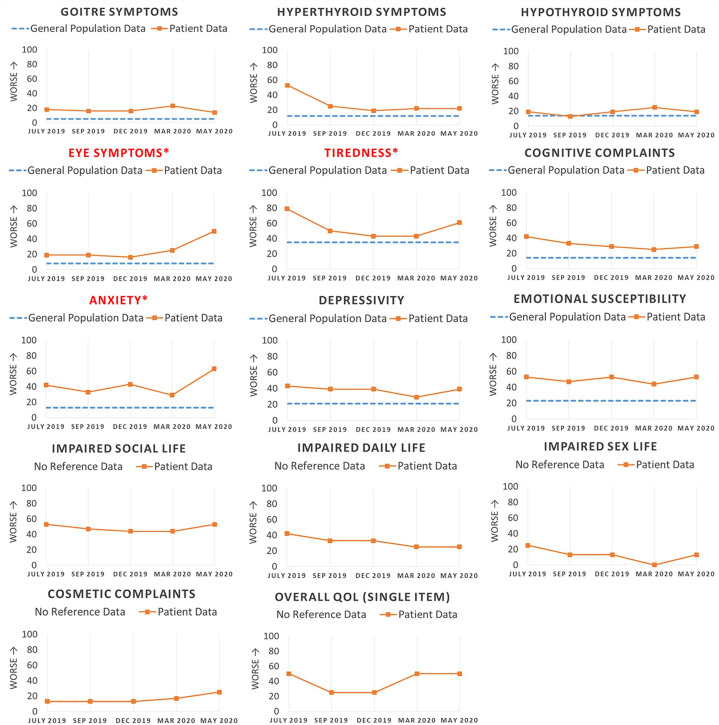
Figure 2.
This figure illustrates how multiple longitudinal quality of life assessments can be presented to the clinician in the electronic health record. In this made-up example, a patient with newly diagnosed Graves’ disease completes the ThyPRO survey before each consultation. An indicator of worse QoL is seen to the left of the vertical axis as some PROs are scored opposite than ThyPRO (i.e. higher scores indicate better QoL). Reference scores are shown with blue dotted lines to facilitate the interpretation of patient scores. Scales are marked with an asterisk sign (*) and the scale name highlighted in red if the scores have deteriorated more than the MIC (minimal important change) (29), enabling the clinician to get a fast overview of domains with worsening QoL. Note: Items in scales of the two bottom rows are asked with attribution to thyroid disease and cannot be answered by respondents from the general population.

