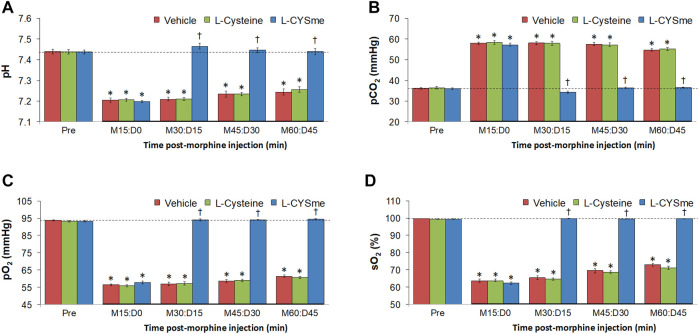
FIGURE 10.
Values of pH Panel (A), pCO2 Panel (B), pO2 Panel (C) and sO2 Panel (D) before (Pre) and after injection of morphine (10 mg/kg, IV) in three separate groups of freely-moving rats followed by injection of vehicle (VEH, saline), L-cysteine (500 μmol/kg, IV) or L-cysteine methyl ester (L-CYSme, 500 μmol/kg, IV). The terms M15, M30, M30, M45 and M60 denote 15, 30, 45 and 60 min after injection of morphine. The terms D0, D15, D30 and D45 denote 0, 15, 30 and 45 min after injection of drug (vehicle, L-Cysteine or L-CYSme). The data are prsented as mean ± SEM. There were 9 rats in each group. *p < 0.05, significant change from Pre values. † p < 0.05, significant change between L-CYSme versus vehicle.

