
Figure 3.
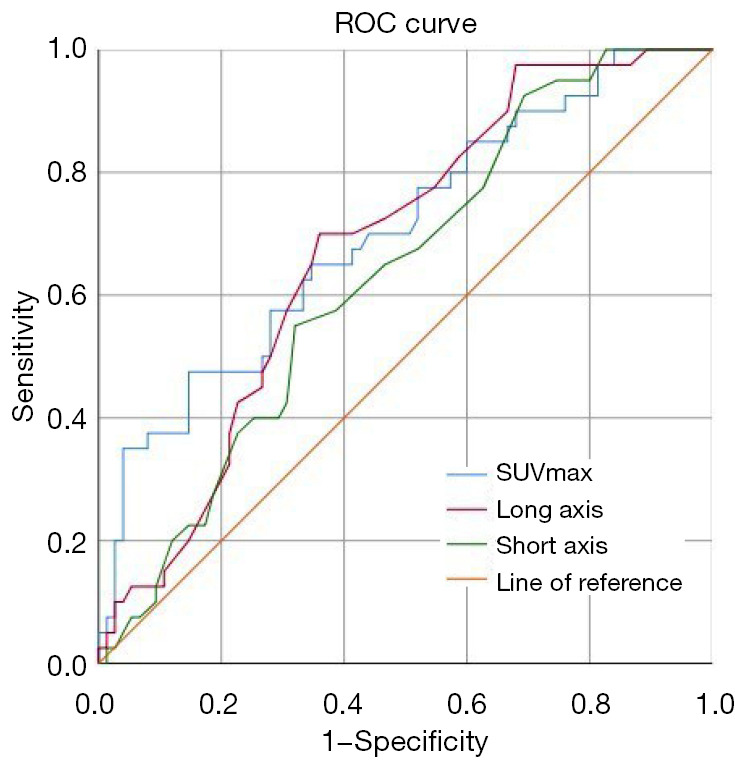
ROC curves of SUVmax, long axis, and short axis of mediastinum/hilar lymph nodes on 18F-FDG PET/CT to predict sarcoidosis. The areas under the curves were 0.702 for SUVmax, 0.676 for the long axis, and 0.632 for the short axis. The optimal cut-off values were 13.86, 21.5, and 11.5 mm, respectively. The sensitivities and specificities were 47.5% and 85.3% for SUVmax, 70.0% and 64.0% for long axis, 92.5% and 30.7% for short axis. ROC, receiver operating characteristic; SUVmax, maximum standardized uptake value; 18F-FDG PET/CT, 18-fluorodeoxyglucose positron emission tomography/computed tomography.