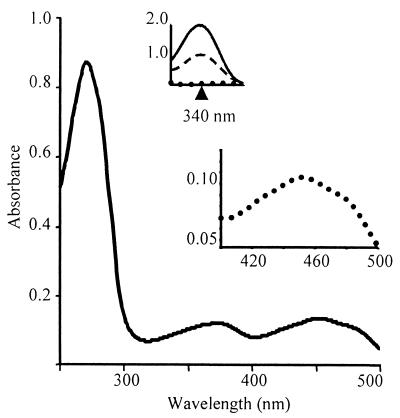
FIG. 3.
Absorption spectra of rNADH oxidase A2. Purified rNoxA2 (190 μg) was incubated with 25 mM NaPi (pH 6.0) and 50 mM NaCl with 320 μM FAD and then dialyzed in the same buffer to remove unbound FAD. The spectrum shows peaks characteristic of FAD at 373 and 451 nm and a shoulder at 480 nm. The ratio of FAD to rNoxA2 was 1.1:1. (Insets) Redox peaks of FAD (lower) at 451 nm and NADH (upper) at 340 nm. Dotted line, absorption spectrum of enzyme (190 μg) following flushing with nitrogen gas; solid line, spectrum of rNoxA2 following addition of NADH (400 μM); dashed line, spectrum of rNoxA2 following the mixing of oxygen with the enzyme.

