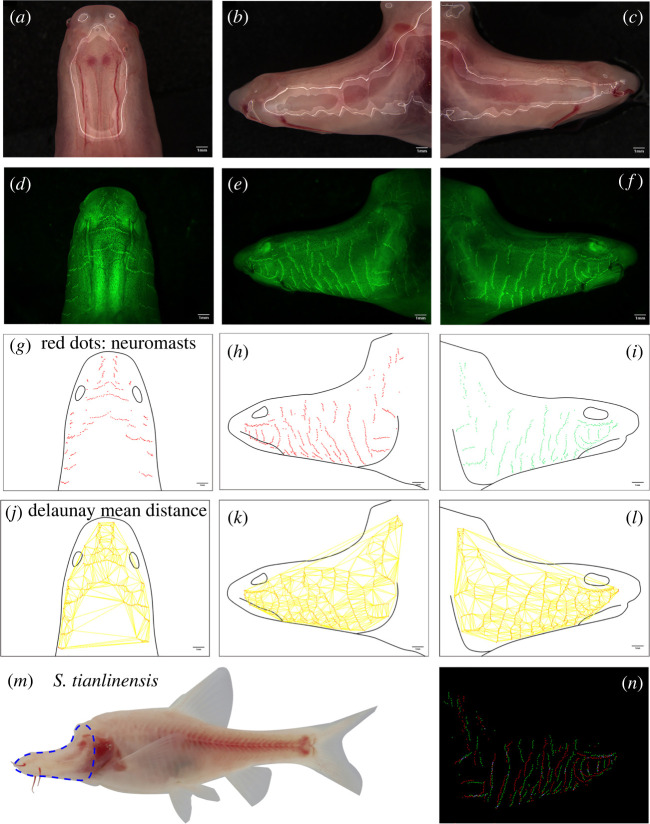
Figure 2.
Imaging, quantification and data collection from a representative Sinocyclocheilus individual. A representative S. tianlinensis is bright-field and fluorescent imaged in the dorsal (a,d), left-lateral (b,e) and right-lateral (c,f) aspects. The areas of each aspect of the head were collected (black lines, (g–i)) and the precise positions of each superficial neuromast were recorded (red dots, (g–i)) based on DASPEI-positive signals from each fluorescent image (green, (d–f)). The mean distance between all head neuromasts was calculated using Delaunay Voronoi triangulation (yellow lines, (j–l); see Methods). The area of the head scored in each individual (blue dotted lines, (m)) was compared for left- and right-sided positions of neuromasts (red and green dots, (n)). The overlap in position of neuromasts, i.e. the ‘OC’ for each individual was quantified (e.g. OC = 0.086) using the JACop feature in FIJI. Scale = 1.0 mm. (Online version in colour.)

