
Figure 2.
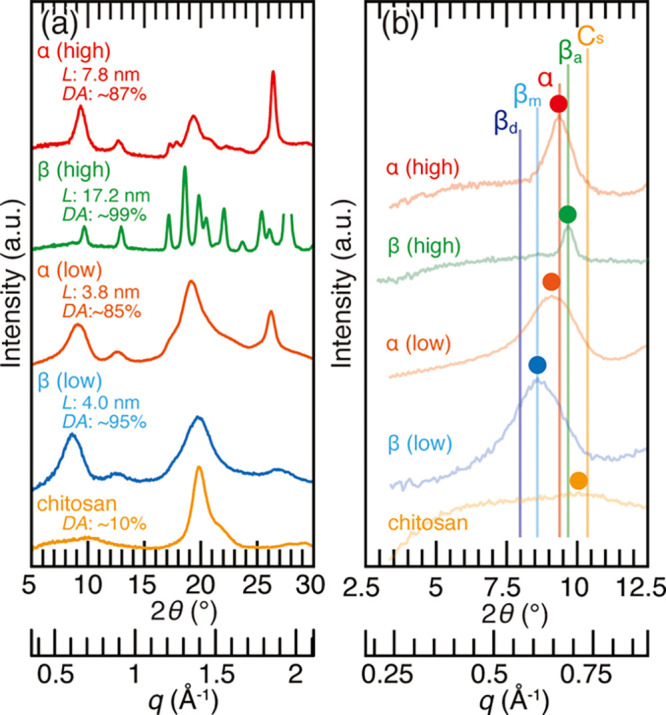
(a) X-ray diffraction profiles of the chitin samples used in this study. From top to bottom, king crab carapace, siboglinid worm tube, N-acetylated chitosan, squid pen, and commercial chitosan were used as the representatives of high (″high″ in red) and poorly (″low″ in orange) crystalline α-chitin, high (″high″ in green) and poorly (″low″ in blue) crystalline β-chitin, and samples with a low degree of acetylation (″chitosan″ in yellow), respectively. The values L and DA are the crystal size calculated from the peaks at 2θ = 8.5–9.7° [diffraction of (020) planes in α-chitin and (010) planes in β-chitin] and the degree of acetylation, respectively; (b) enlarged profiles of Figure 2a. α, βa, βm, βd, and Cs represent the peak positions of α-chitin, anhydrous β-chitin, β-chitin monohydrate, β-chitin dihydrate, and chitosan from the literature data.15,41,42,52,53,59 Colored dots represent the peak top position of the profiles.