
Figure 3.
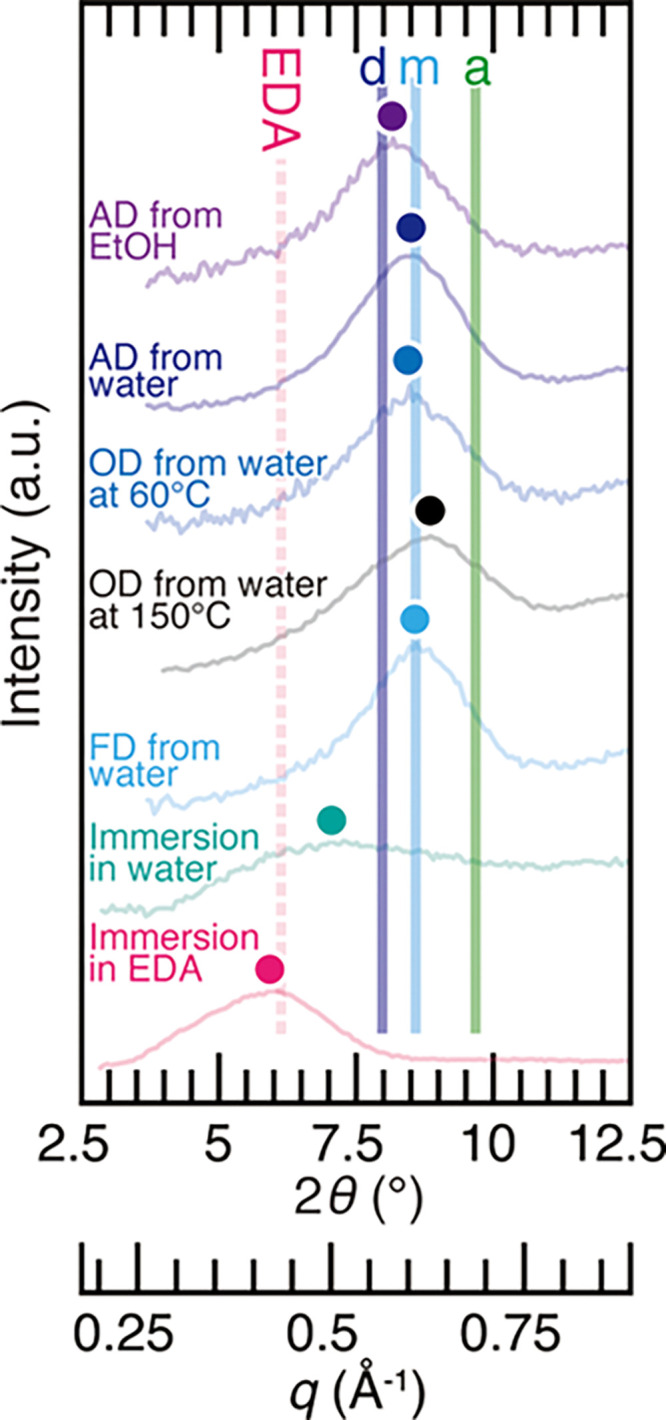
X-ray diffraction profiles of the squid pen prepared under different conditions. AD, OD, and FD represent air-dried, oven-dried, and freeze-dried, respectively. a, m, d, and EDA represent the peak positions of anhydrous β-chitin, β-chitin monohydrate, β-chitin dihydrate, and type II form of β-chitin/EDA complex from the literature data.42,53,61 Colored dots represent the peak top position of the profiles.