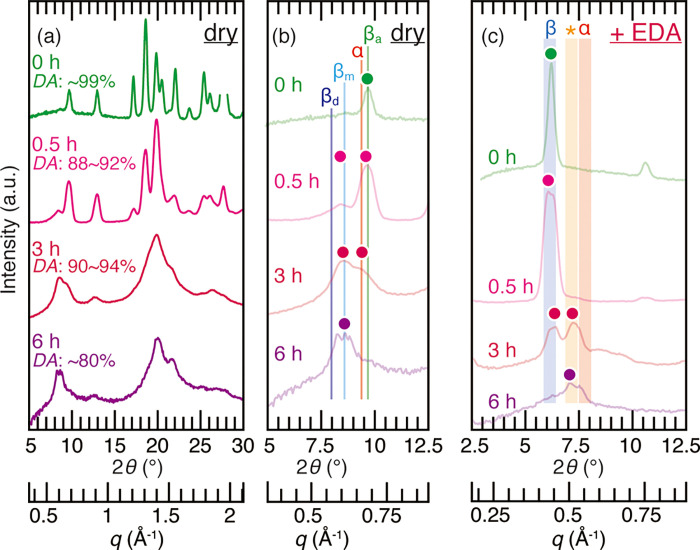
Figure 6.
(a) X-ray diffraction profiles of the siboglinid worm tube treated with 12.5 M NaOH for 0 (water), 0.5, 3, and 6 h. The DA values indicate the degrees of acetylation; (b) enlarged profiles of Figure 6a. α, βa, βm, and βd represent the peak positions of α-chitin, anhydrous β-chitin, β-chitin monohydrate, and β-chitin dihydrate from the literature data,15,52,53 respectively. Colored dots represent the peak top position of profiles; (c) X-ray diffraction profiles of the EDA complex of the siboglinid worm tube treated with 12.5 M NaOH for 0 (water), 0.5, 3, and 6 h. Shades denoted as α, *, and β are the same as in Figure 4. Colored dots represent the peak top position of profiles.

