
Figure 7.
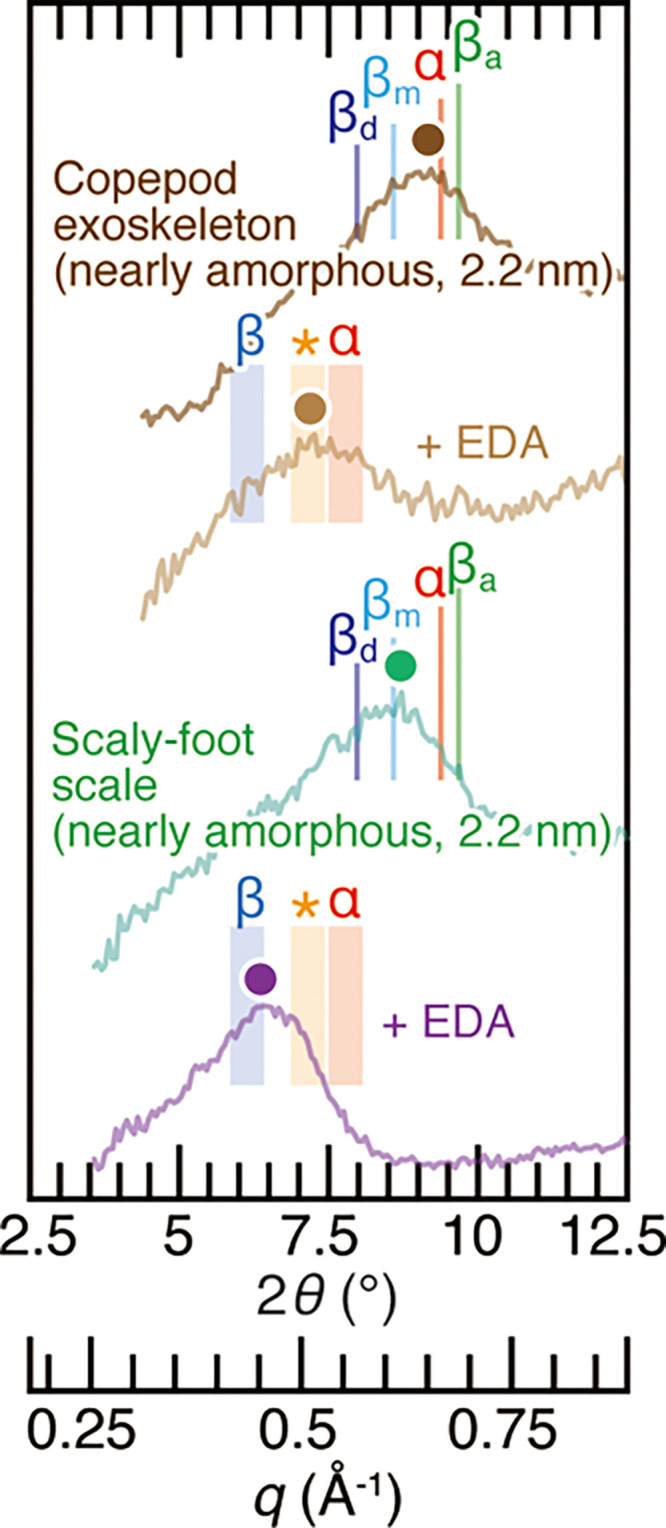
X-ray diffraction profiles of near-amorphous α-chitin copepod exoskeletons, those complexed with EDA, the near-amorphous β-chitin Scaly-foot Snail scale (sampled position near the distal tip of the scale), and the one complexed with EDA. α, βa, βm, and βd represent the peak positions of α-chitin, anhydrous β-chitin, β-chitin monohydrate, and β-chitin dihydrate from the literature data.15,52,53 Shades denoted as α, *, and β are the same as in Figure 4. Colored dots represent the peak top position of profiles. The values in the brackets are the crystal size calculated from the peaks at 2θ = 8.5–9.3° (diffraction of (020) planes in α-chitin and diffraction of (010) planes in β-chitin).