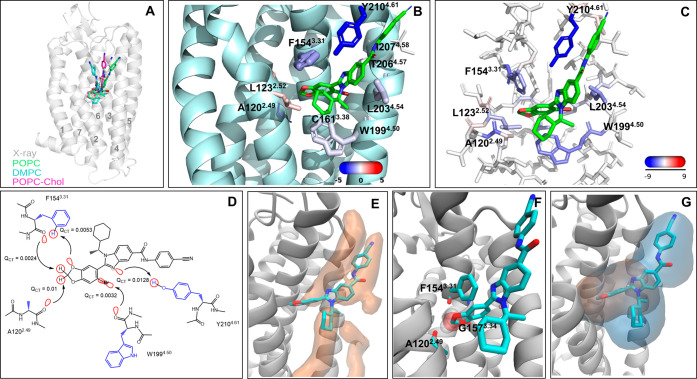
Figure 1.
Extrahelical allosteric site of PAR2 and its interactions from MD simulations and quantum chemical calculations. (A) Overall location of AZ3451 in PAR2. The overlay of the X-ray position with the average position of AZ3451 in the POPC, DMPC, and POPC-Chol simulations. The helices are labeled. (B) Zoomed view of the binding site. The key residues forming contacts with AZ3451 are shown in stick representation. The size and color of the residues correspond to the relative strength of van der Waals (vdW) and electrostatic interactions with the ligand, respectively. The actual values of the interaction energies are shown in Table S1. (C) Electrostatic energy from the F/I-SAPT calculations mapped to the allosteric site residues. (D) Two-dimensional (2D) view of the key AZ3451–PAR2 interactions and the value of the QCT descriptor. The backbone and the side chain of residues are colored black and blue. The orbital interactions responsible for charge transfer (QCT) between a donor and an acceptor are visualized in red. The direction of the charge transfer is shown by arrows. The backbone and the side chain of residues are colored black and blue. (E) Low-energy lipid area (in orange surface) in the allosteric site obtained from the grid free energy (GFE) calculation based on the POPC simulations of the receptor empty form. The ligand is shown for clarity of the allosteric site location. (F) Overlay of AZ3451 (in a stick) and a water molecule (in transparent SPK representation) from the MD simulations. In the simulations of the receptor empty form, a water molecule frequently occupies the binding pocket of the dioxolane moiety forming H-bonding interactions with the backbone of A120, F154, and G157. (G) Overlay of the allosteric cavities from MDpocket calculation with the selection of only receptor atoms (orange surface) and receptor–lipid atoms (blue surface). The ligand is shown for clarity of the binding site location. The results are shown for the POPC simulations, and the others can be found in Figure S2. The lipid atoms were selected at a distance of 6 Å from the selected receptor atoms.

