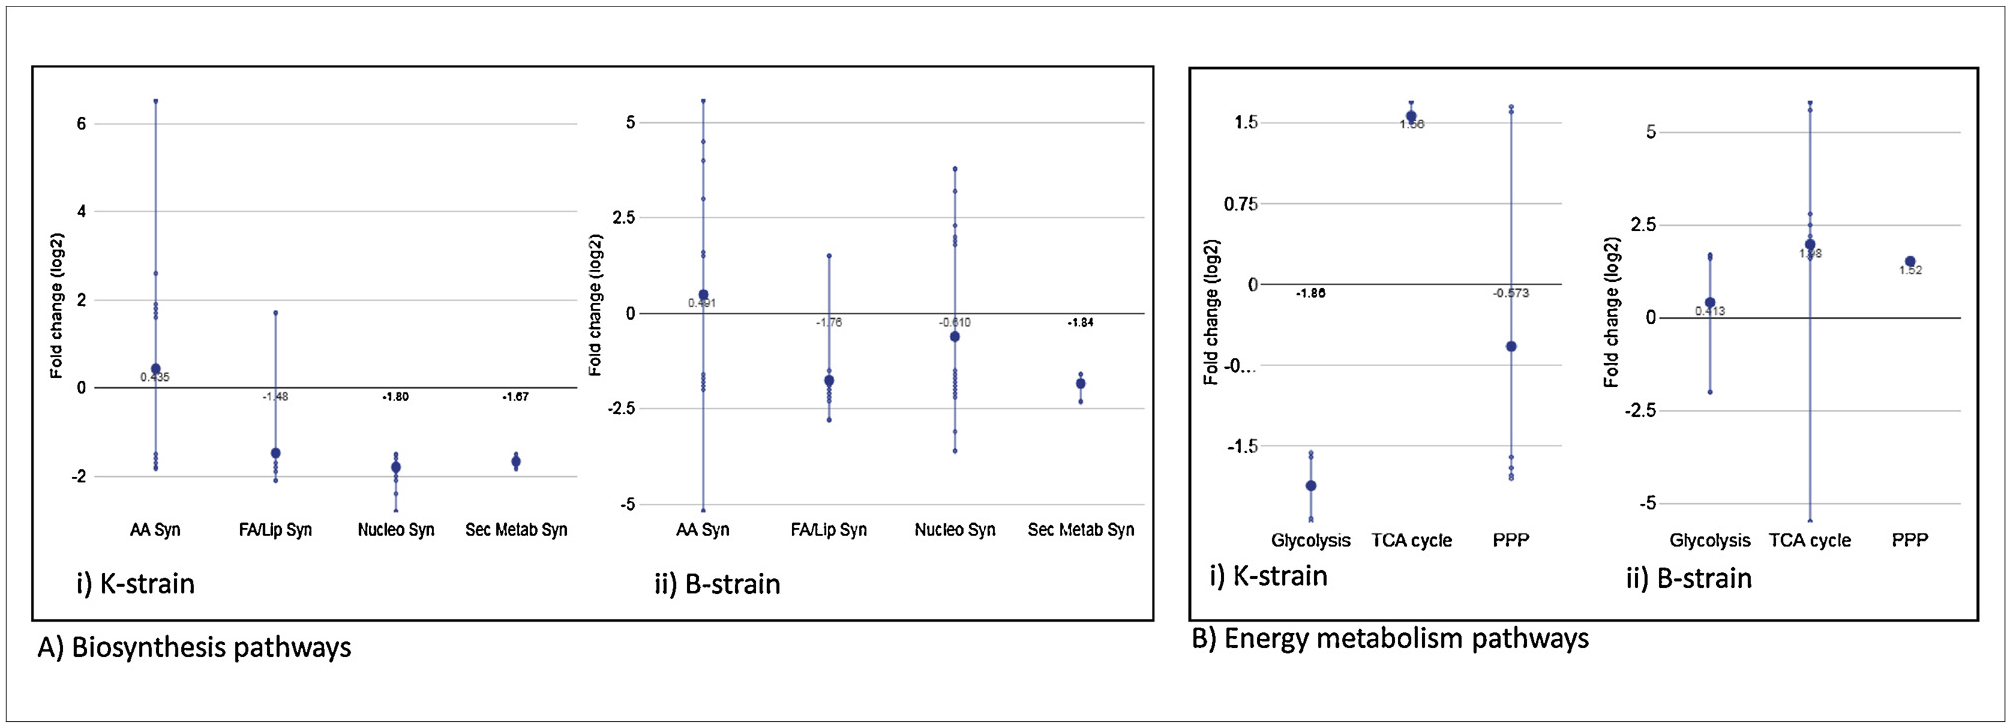
Fig. 4.

Gene expression distribution of: (A) biosynthesis pathways, i.e. amino acid biosynthesis, fatty acids and lipids biosynthesis, nucleosides and nucleotides biosynthesis and secondary metabolites biosynthesis; and (B) Energy metabolism pathways, i.e. glycolysis, TCA and PPP in (i) K-strain and (ii) B-strain. The small dots represent the fold change difference in expression between growth in medium without CAA and with CAA samples using a log2 scale. The large dot represents the average (mean) of small dots (using the EcoCyc omics dashboard).
