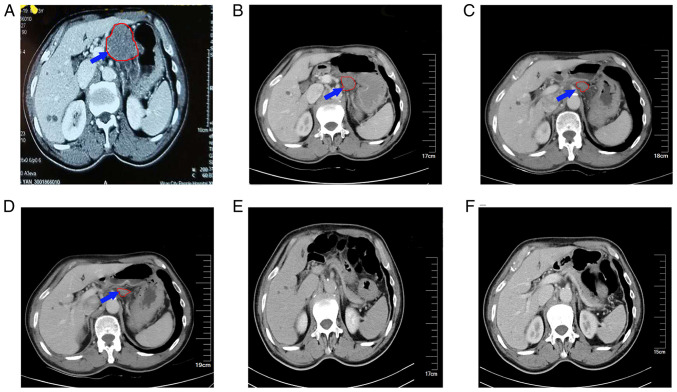
Figure 4.
Abdominal enhanced CT in which the blue arrow and red outline indicate swollen lymph nodes and their boundary at the lesser curvature of stomach, which gradually shrank and then disappeared after treatment. (A) Abdominal CT scan performed on December 17, 2018, showing lymph nodes in the lesser curvature of the stomach ~4.5×3.5 cm in size. (B) Abdominal CT scan carried out on March 7, 2019, showing that the lymph nodes in the lesser curvature of the stomach had decreased to ~ 3.5×2.5 cm. (C) Abdominal CT scan performed on May 23, 2019, showing a further reduction in the size of the lymph nodes to ~2.5×1.5 cm. (D) Abdominal CT carried out on October 21, 2019, indicating that the size of the lymph nodes was ~2×1.1 cm. Abdominal contrast-enhanced CT scans performed on (E) August 18, 2020 and (F) May 11, 2021, showing that the enlarged lymph nodes in the lesser curvature had disappeared. CT, computed tomography.

