Figure 1.
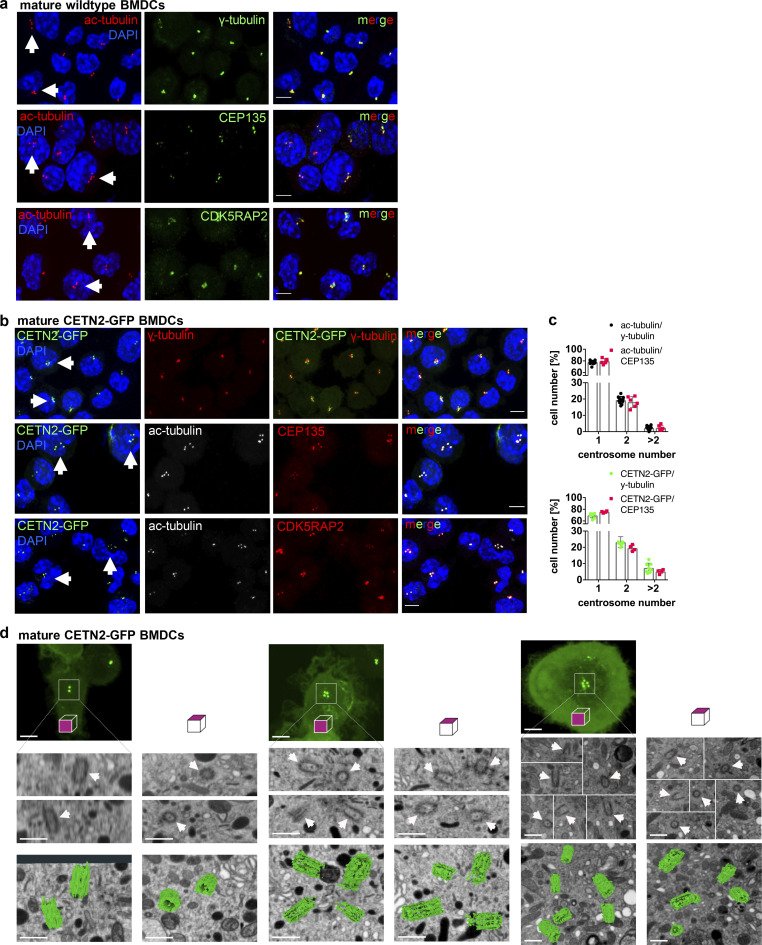
Visualization and quantification of centrosome numbers in BMDCs. (a) Immunostaining of centrioles and PCM in mature WT BMDCs. Merged and individual channels of ac-tubulin/DAPI (red/blue) and γ-tubulin, CEP135, and CDK5RAP2 (all displayed in green) are shown. White arrows point to cells with ≥4 ac-tubulin+ foci. Scale bars, 5 μm. (b) Immunostaining of centrioles and PCM in mature CETN2-GFP expressing BMDCs. Merged and individual channels of CETN2-GFP/DAPI (green/blue), ac-tubulin (gray), γ-tubulin, CEP135, and CDK5RAP2 (all displayed in red) are shown. White arrows point to cells with ≥4 CETN2-GFP+ foci. Scale bars, 5 μm. (c) Upper panel: Quantification of centrosome numbers in mature WT BMDCs according to ac-tubulin/γ-tubulin+ and ac-tubulin/CEP135+ foci. Graph shows mean values ± SD of 12 independent experiments (ac-tubulin/γ-tubulin) with N = 344/274/154/146/131/232/200/175/184/224/151/268 cells analyzed per experiment and 6 independent experiments (ac-tubulin/CEP135) with N = 270/254/206/207/222/225 cells analyzed per experiment. Lower panel: Quantification of centrosome numbers in mature CETN2-GFP expressing BMDCs according to CETN2-GFP/γ-tubulin+ and CETN2-GFP/CEP135+ foci. Graph shows mean values ± SD of eight independent experiments (CETN2-GFP/γ-tubulin) with N = 261/248/305/298/180/150/258/152 cells analyzed per experiment and four independent experiments (CETN2-GFP/CEP135) with N = 335/366/222/184 cells analyzed per experiment. (d) FIB-SEM of mature CETN2-GFP expressing BMDCs. Upper panel: CETN2-GFP fluorescent maximum intensity Z-stack projection images. Scale bars, 5 µm. Middle panel: Individual planes of the FIB-SEM 3D dataset containing centriole cross-section images. White arrows point to individual centrioles. Scale bars, 500 nm. Lower panel: 3D reconstruction of segmented centrioles (green). Scale bars, 500 nm. For each cell, xyz (left) and xzy (right) stacks are shown. One representative cell with one, two, and more than two centrosomes has been imaged. See also Video 1.

