Figure 2.
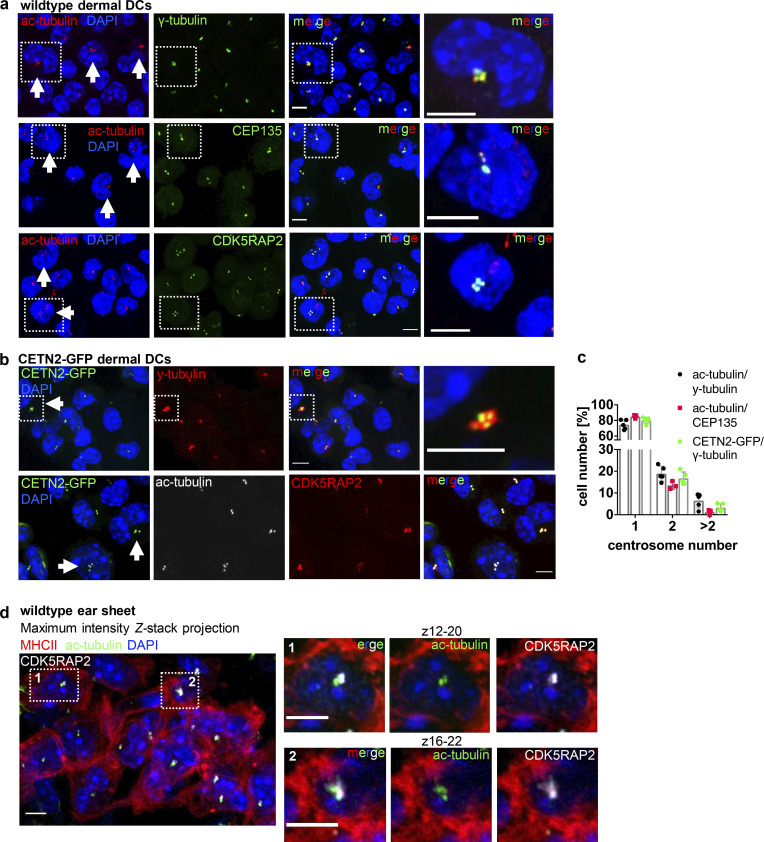
Visualization and quantification of centrosome numbers in dermal DCs. (a) Immunostaining of dermal DCs isolated from WT ear explants. Merged and individual channels of ac-tubulin/DAPI (red/blue), γ-tubulin, CEP135, and CDK5RAP2 (all displayed in green) are shown. White arrows point to cells with ≥4 ac-tubulin+ foci. Right panels: Magnification of boxed regions. Scale bars, 5 μm. (b) Immunostaining of centrioles and PCM in dermal DCs isolated from CETN2-GFP expressing ear explants. Merged and individual channels of CETN2-GFP/DAPI (green/blue), γ-tubulin, and CDK5RAP2 (both displayed in red) and ac-tubulin (gray) are shown. White arrows point to cells with ≥4 CETN2-GFP+ foci. Scale bars, 5 μm. (c) Quantification of centrosome numbers in WT and CETN2-GFP expressing dermal DCs according to ac-tubulin/γ-tubulin+, ac-tub/CEP135+, and CETN2-GFP/γ-tubulin+ foci. Graph displays mean values ± SD of three to five independent experiments. N = 96/90/109/131/108 cells (ac-tubulin/γ-tubulin), 129/285/238 (ac-tub/CEP135+). and 131/78/95/184/239 cells (CETN2-GFP/γ-tubulin) pooled from three different mice for each experiment. (d) Immunostaining of centrioles and PCM in WT skin explants. Left: Merged channels of ac-tubulin (green), CDK5RAP2 (gray) and MHCII (red) are shown. Right: Magnification of boxed regions. Only indicated Z planes were projected. Scale bars, 5 μm. All nuclei were counterstained with DAPI (blue).

