Figure 3.
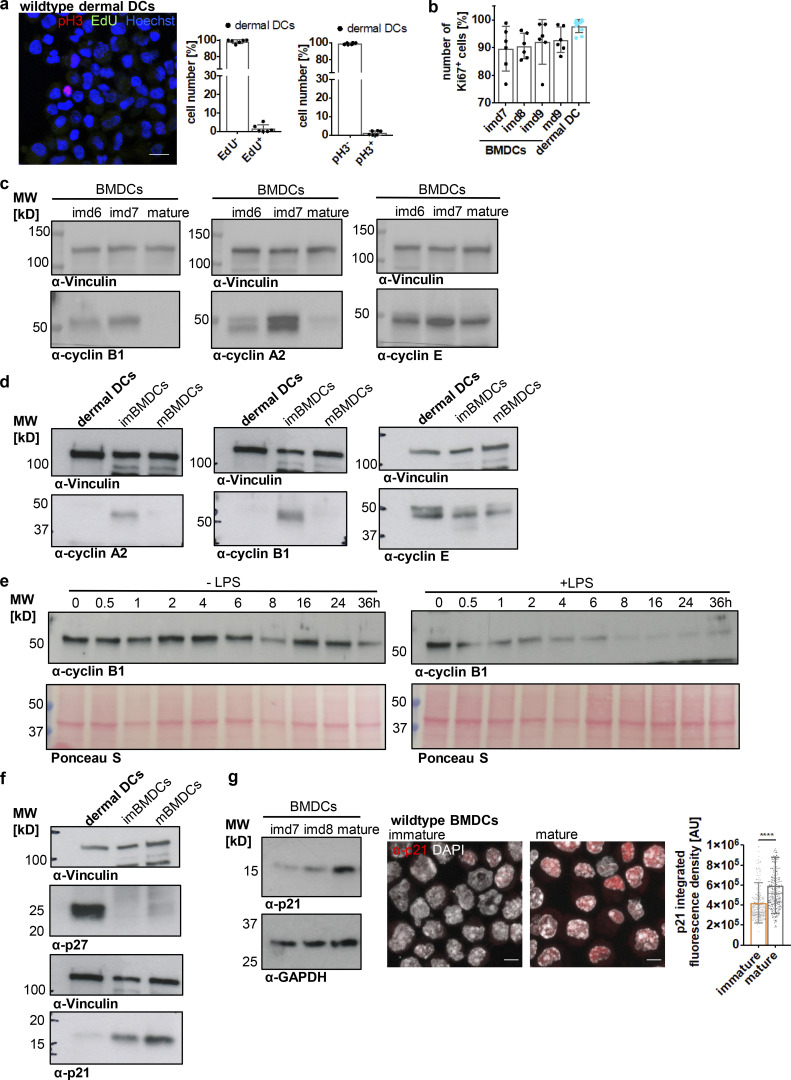
Mature DCs arrest during the cell cycle with cells containing two and more centrosomes. (a) EdU incorporation and pH3 staining in WT dermal DCs isolated from split ears. Left: Immunostaining of WT dermal DCs against pH3 (red) and EdU (green) incorporation. Scale bar, 10 μm. Right: Quantification of EdU+ and pH3+ dermal DCs. Graphs display mean values ± SD of six independent experiments. N = 84/119/316/181/191/183 cells, pooled from three different mice for each experiment. (b) Ki67 staining in differentiating WT BMDCs (black) and WT dermal DCs (blue). Graph displays mean values ± SD of 6 (BMDCs) and 11 (dermal DCs) independent experiments. N = 10,000 cells (BMDCs) and at least 2,100 cells (dermal DCs) analyzed per experiment. (c and d) Immunoblotting of cyclins during WT BMDC differentiation and maturation and in WT dermal DCs (d). One representative experiment out of three is shown. (e) Immunoblotting of cyclin B1 in unstimulated WT BMDCs (− LPS; left panel) and after LPS-stimulation (+ LPS; right panel). Ponceau S stained membranes represent loading controls. One representative experiment out of two is shown. (f and g) Immunoblotting of Cdk inhibitors in WT dermal DCs and immature and mature WT BMDCs (g). Samples in d and f are derived from the same experiment. Membranes have been cut after transfer and probed with the indicated antibodies. Vinculin serves as loading control for both experiments. One representative experiment out of three is shown. (g) Middle: Immunostaining and quantification (right) of nuclear p21 levels in immature and mature WT BMDCs. Graph displays mean values ± SD of N = 242 cells (immature) and 232 cells (mature). One representative experiment out of three is shown. ****, P < 0.0001 (Mann-Whitney test). im, immature; m, mature; d, day; MW, mol wt. Source data are available for this figure: SourceData F3.

