Figure 5.
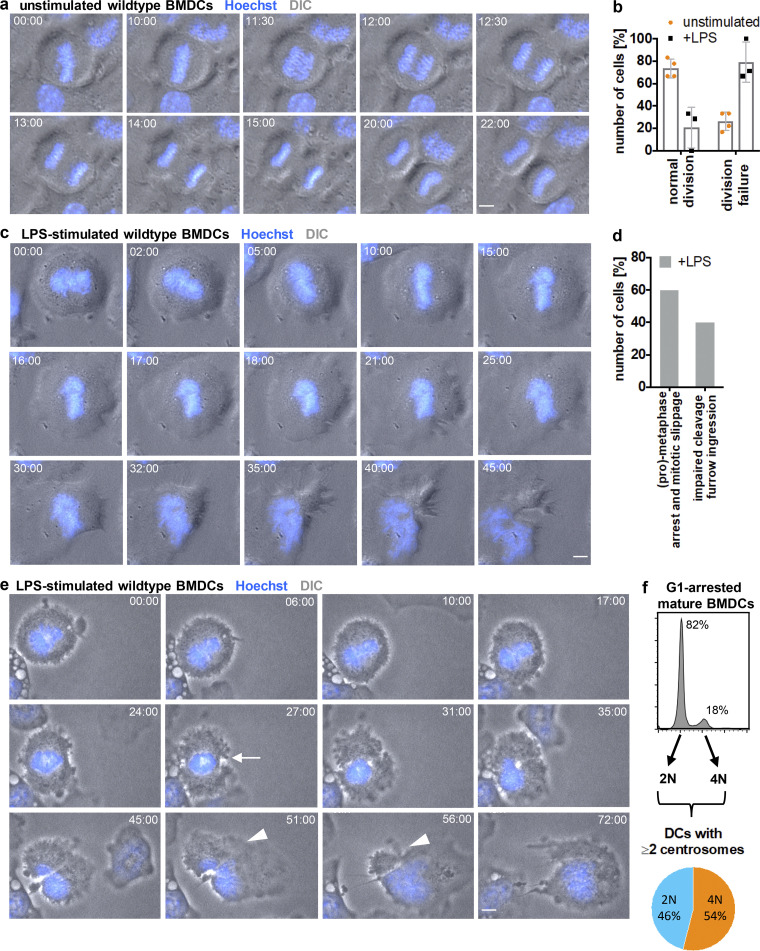
Antigen encounter modifies the cell division cycle in DCs. (a) Time-lapse live-cell epifluorescence microscopy of unstimulated immature WT BMDCs progressing though mitosis. Merged images of DIC (gray) and Hoechst (blue) are shown. Frames were collected every 15 s. See also Video 2 and Fig. S3 a. (b) Quantification of successful mitotic divisions in WT BMDCs without (unstimulated) and after LPS (+LPS) stimulation. Graph displays mean values ± SD of three to four independent experiments. N = 15/9/6/7 mitotic cells analyzed per experiments. (c) Time-lapse live-cell epifluorescence microscopy of WT BMDCs stimulated with LPS. Merged images of DIC (gray) and Hoechst (blue) are shown. Frames were collected every 15 s. See also Video 3 and Fig. S3 b. (d) Quantification of mitotic errors in WT BMDCs after LPS stimulation. N = 20 mitotic cells analyzed and pooled from three independent experiments. (e) Time-lapse live-cell epifluorescence microscopy of WT BMDCs stimulated with LPS showing impaired cleavage furrow ingression. Merged images of DIC (gray) and Hoechst (blue) are shown. White arrow indicates beginning of cleavage furrow ingression. White arrowheads denote regression of the cleavage furrow. Frames were collected every 15 s. See also Video 4 and Fig. S3 c. All scale bars, 5 μm. (f) Diagram illustrating the frequency of diploid and tetraploid DCs after maturation. Pictures in a, c, and e constitute key images derived from Fig. S3.

