Figure 7.
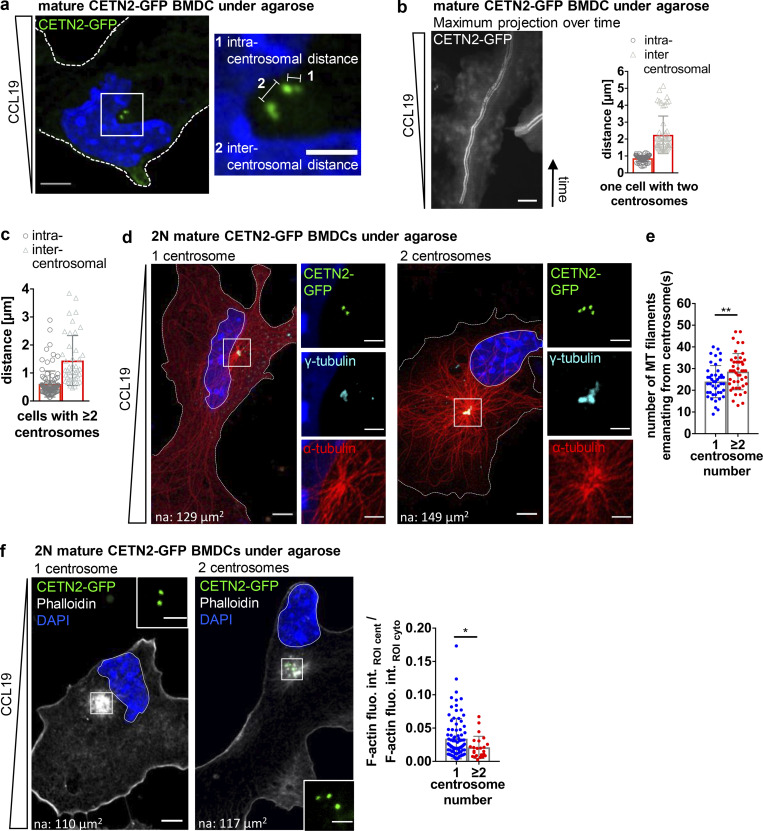
Extra centrosomes nucleate MT filaments and cluster during migration. (a) Left: Mature CETN2-GFP expressing BMDC migrating under agarose. Cell outline is indicated with white dashed line. Scale bar, 5 μm. Right: Magnification of boxed region with illustration of intra- and intercentrosomal distances in a cell with multiple centrosomes. Lines denote distances between centrioles (1; intracentrosomal distance) and centrosomes (2; intercentrosomal distance). Scale bar, 2 μm. (b) Left: Maximum projection of time frames of one representative mature CETN2-GFP expressing BMDC migrating under agarose. Scale bar, 10 μm. Right: Quantification of intra- and intercentrosomal distances during migration. Graph displays mean values ± SD Centrioles are pseudo-color coded in gray. (c) Quantification of intra- and intercentrosomal distances in fixed CETN2-GFP expressing BMDCs with multiple centrosomes. Graph displays mean values ± SD. N = 50 cells pooled from two independent experiments. (d) Immunostaining of MT filaments in mature 2N CETN2-GFP expressing BMDCs migrating under agarose. Left: Merged and individual channels of CETN2-GFP (green), γ-tubulin (cyan), and α-tubulin (red) are shown. Right: Magnification of boxed region highlighting MT-nucleating centrosomes. Images were posttreated by deconvolution. Scale bars, 10 μm. na, nuclear area. (e) Quantification of MT filaments emanating from the centrosome in mature 2N CETN2-GFP expressing BMDCs with one (blue) and multiple (red) centrosomes fixed under agarose. Graph displays mean values ± SD. N = 44 cells (2N, one centrosome) and 45 cells (2N, multiple centrosomes) pooled from seven independent experiments. **, P = 0.007 (two-tailed, unpaired Student’s t test). (f) Left: Phalloidin staining in migrating 2N CETN2-GFP expressing BMDCs fixed under agarose. Merged channels of CETN2-GFP (green), phalloidin (gray), and DAPI (blue) are shown. Scale bar, 10 μm. na, nuclear area. Insets: Magnification of boxed regions. Scale bars, 2 μm. Right: Quantification of centrosomal actin in mature 2N CETN2-GFP expressing BMDCs cells with one (blue) and multiple (red) centrosome(s). Graph displays mean values ± SD. N = 88 cells (2N, one centrosome) and 24 cells (2N, multiple centrosomes) pooled from four independent experiments. *, P = 0.039 (Mann-Whitney test), fluo. int., fluorescence intensity; cent., centrosome; cyto., cytosol.

