Figure 8.
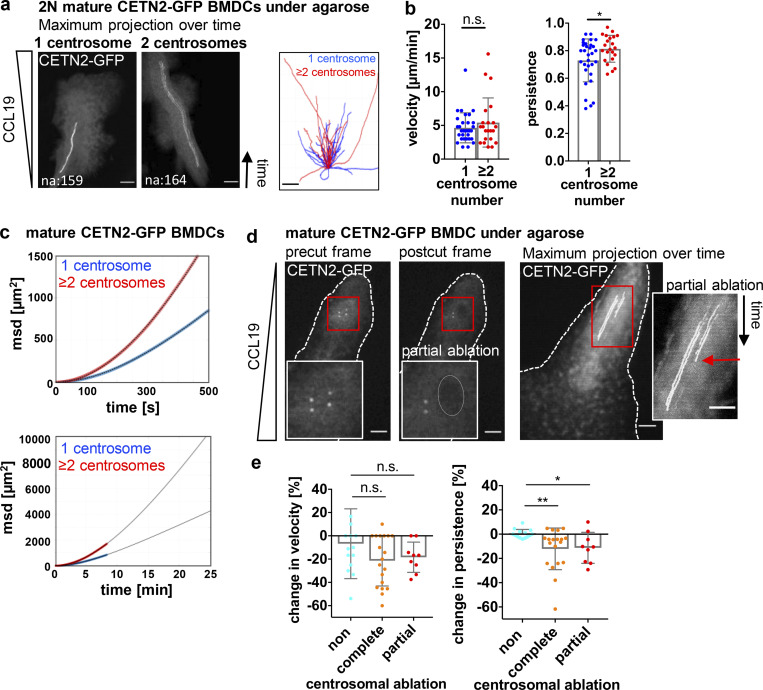
Extra centrosomes promote persistent locomotion. (a) Left: Maximum projection of time frames of mature CETN2-GFP expressing BMDCs migrating under agarose. Right: Single-cell tracks of mature CETN2-GFP expressing BMDCs migrating under agarose. (b) Quantification of migration velocity (left) and persistence (right). Graphs display mean values ± SD. N = 31 cells (2N, one centrosome) and 22 cells (2N, multiple centrosomes) pooled from six independent experiments. *, P = 0.030 (two-tailed, unpaired Student’s t test). (c) msd plots of mature CETN2-GFP expressing BMDCs migrating under agarose. msd values were calculated from single-cell tracks used for velocity and persistence analysis in b (upper graph). Lower graph: Extrapolated msd plots of BMDCs migrating under agarose. Blue and red circles represent experimental data sets. Curves were fitted using Fürth’s formula (see Materials and methods section) and extrapolated for longer time periods (black lines). (d) Illustration of partial laser ablation of centrosomes. Left: Pre- and post-ablation images of a CETN2-GFP expressing cell with two centrosomes migrating under agarose. Insets show magnification of boxed regions. Dotted line indicates the ablated area. Right: Maximum intensity projection over time of one representative cell before and after partial laser ablation. Inset: Magnification of centrosome tracks. Red arrow indicates time point of extra centrosome ablation. Scale bars, 10 μm. (e) Quantification of migration velocity (left) and persistence (right) before and after laser ablation. Graphs display changes as mean values ± SD. N = 14/19/9 cells (non/complete/partial ablation) pooled from six independent experiments. *, P = 0.015 and **, P = 0.009 (Kruskal-Wallis with Dunn’s test). Centrioles in a and d are pseudo-color coded in gray.

