Figure 9.
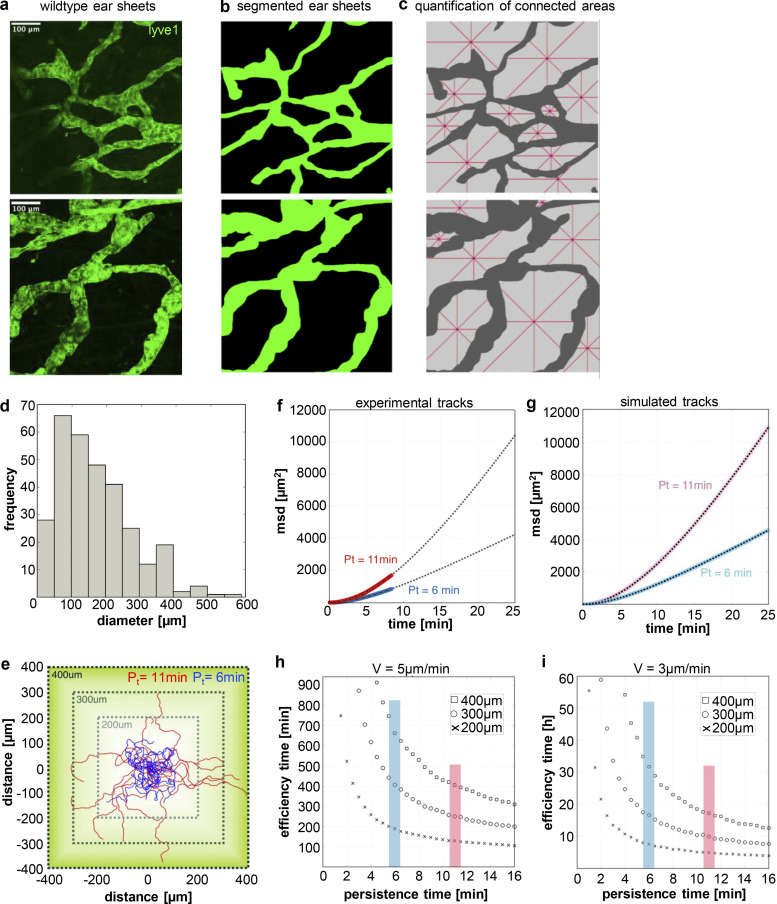
Cell migration persistence affects first passage times to reach the lymphatic system. (a) Maximum Z-stack projection of two exemplary areas of ear dermis stained for lvye1 (green). Scale bar, 100 µm. (b) Binary images from ear dermis shown in a. (c) Quantification of ear dermis area size (light gray) in between lymph vessels (dark gray). Contiguous regions in binary images were separated and individually analyzed for their diameters. Red lines show four diameters (horizontal, vertical, +45°, −45°) starting at the nearest lymph vessel entry. (d) Quantification of ear dermis free area diameters according to c. N = 9 areas pooled from ear sheets of three different mice. (e) Square design of three simulation areas (200, 300, and 400 µm) for persistent random walks using the speed and persistence values from experimental data. For comparison the start value for both cases (Pt = 11 min [red] and Pt = 6 min [blue]) were set to (0,0). (f and g) Experimental (f) and simulated (g) msd to time plots showing that the simulated persistent random walks (light red and light blue) closely resemble the experimental data (red and blue). (h and i) Efficiency time as a function of persistence time from persistent random walks with v = 5 µm/min (h) and v = 3 µm/min (i). Efficiency time represents the time that >99% of the persistent random walkers reached a boarder of the square. The start points are set randomly inside the square.

