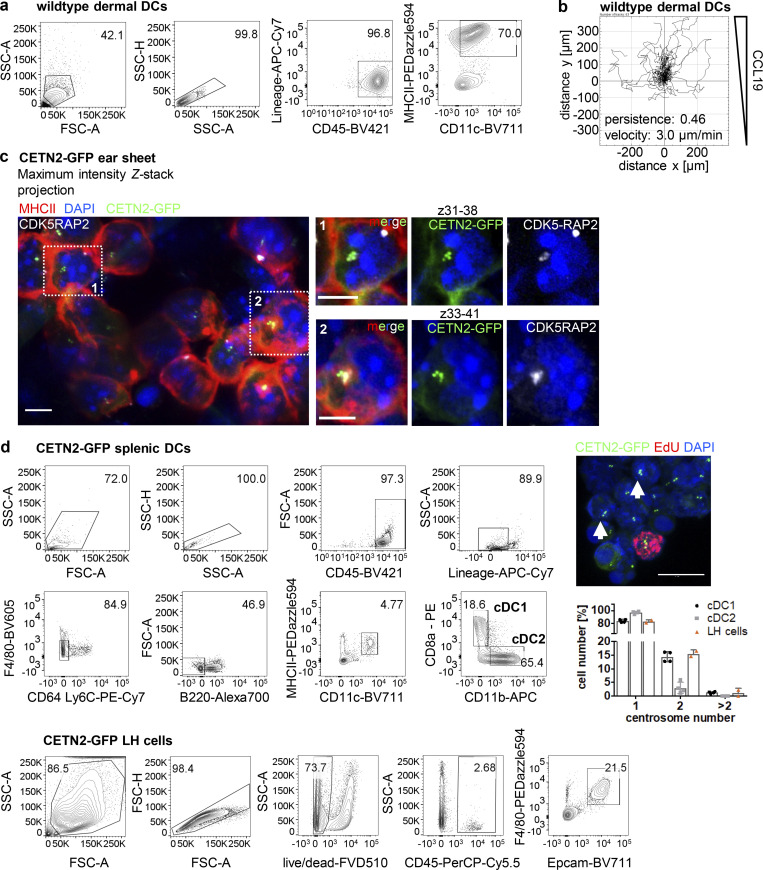
Figure S1.
Visualization and quantification of centrosomes in immune cells. (a) Characterization of DCs attained from skin explant culture. Skin DCs emigrated from skin explants cultured on medium supplemented with CCL19 and showed high cell surface levels of CD11c and MHCII. (b) Single-cell tracks of dermal DCs migrating in response to CCL19 gradients in 3D collagen gels. N = 63 cells pooled from two independent experiments. (c) Immunostaining of MHCII (red) and CDK5RAP2 (gray) in CETN2-GFP expressing skin explants. Left: Maximum intensity Z-stack projection of MHCII+ dermal DCs. Right: Magnification of boxed regions. Only indicated Z planes were projected. Scale bars, 5 μm. (d) Quantification of centrosome numbers in splenic DCs and LH cells prepared from epidermal sheets. Left panel: Gating strategy for splenic DCs and LH cells isolated from CETN2-GFP expressing mice. Centrosome numbers were quantified in cDC1 (MHCII+/CD11c+/CD8+) and cDC2 (MHCII+/CD11c+/CD11b+) subpopulations and LH cells (F4/80+/EpCAM+). Upper right picture: CETN2-GFP signals (green) and EdU-incorporation in cDC1. EdU+ cells (red) were excluded from the analysis as they indicate ongoing cell proliferation. White arrows point to extra centrosomes. Scale bar, 10 μm. Middle right panel: Quantification of centrosome numbers in splenic cDC subsets and LH cells sorted from epidermal sheets. Graph displays mean values ± SD of four (cDC) or two (LH cells) independent experiments. N = 242/359/337/161 cells (cDC1), 152/209/439/153 cells (cDC2) and 127/41 cells (LH cells).

