Figure S2.
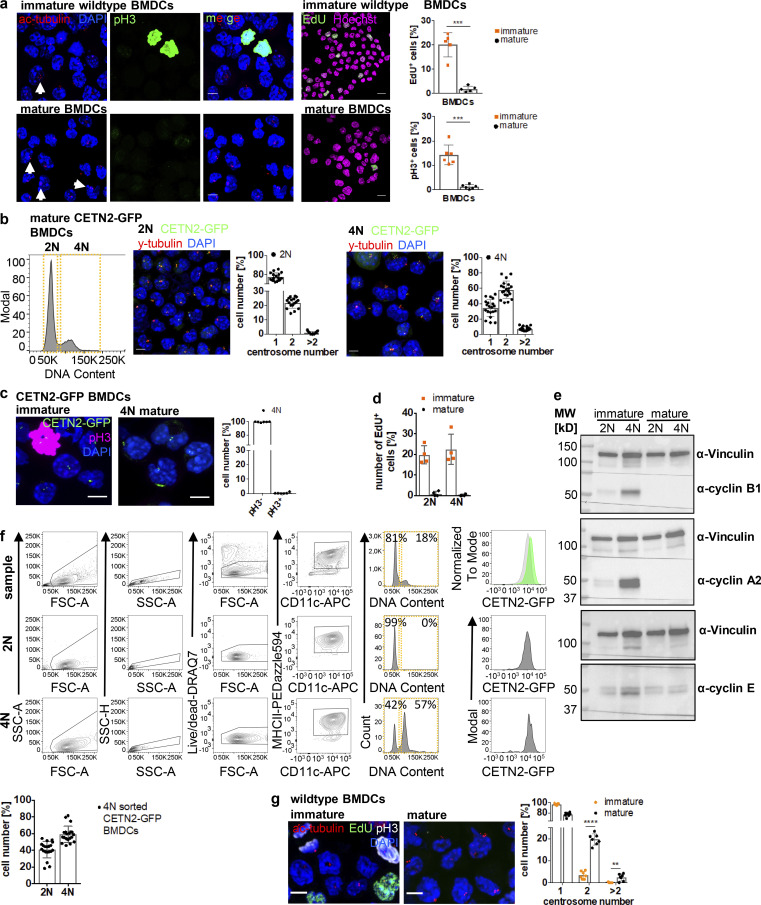
Mature DCs arrest during the cell cycle with cells containing two and more centrosomes. (a) Left: Immunostaining of ac-tubulin (red) and pH3 (green) in immature (upper panel) and mature (lower panel) WT BMDCs. White arrows point to extra centrosomes. Scale bars, 5 μm. Middle: EdU incorporation (green) in immature and mature WT BMDCs. Nuclei were counterstained with Hoechst (magenta). Scale bars, 10 μm. Right: Quantification of EdU+ and pH3+ cells in immature and mature WT BMDCs. Graph shows mean values ± SD of five (EdU) and six (pH3) independent experiments. EdU: N = 272/205/509/356/423 cells (immature) and 171/192/286/286/217 cells (mature). ***, P = 0.0009 (two-tailed, unpaired student’s t test with Welch’s correction). pH3: N = 134/98/158/125/93/124 cells (immature) and 141/203/158/204/127/128 cells (mature). ***, P = 0.0004 (two-tailed, unpaired Student’s t test with Welch’s correction). (b) Separation of 2N and 4N mature CETN2-GFP expressing BMDCs by flow cytometry. Left: Representative histogram of DNA content distribution of MHCII+/CD11c+ BMDCs. Gates for separating 2N and 4N cells are displayed in orange. Right: Immunostaining of PCM (γ-tubulin; red) and quantification of CETN2-GFP+ foci in enriched mature 2N and 4N CETN2-GFP expressing BMDCs. Scale bars, 5 μm. Graphs display mean values ± SD. N = 20 with at least 141 cells analyzed per experiment. (c) Left: Immunostaining of pH3 in immature (left panel) and sorted mature 4N (right panel) CETN2-GFP expressing BMDCs. Right: Quantification of pH3+ in sorted mature 4N cells. Graph shows mean values ± SD of six independent experiments with N = 417/485/309/411/298/497 cells analyzed per experiment. Scale bars, 5 μm. (d) Quantification of EdU incorporation in sorted immature and mature 2N and 4N BMDCs. Graph shows mean values ± SD of four independent experiments with N = 4 with at least 131 cells analyzed per experiment. (e) Immunoblotting of cyclins in immature (im) and mature (m) CD11c+ CETN2-GFP expressing BMDCs sorted on DNA content. One representative experiment out of three is shown. MW, mol wt. (f) Post-sort analysis of 2N and 4N mature CETN2-GFP expressing BMDCs separated as described in b. Graph displays mean values ± SD. N = 20 with at least 1,000 cells analyzed per experiment. (g) Left: Immunostaining of immature and mature WT BMDCs against ac-tubulin (red), EdU-incorporation (green), and pH3 (white). Scale bars, 5 μm. Right: Quantification of centrosome numbers according to ac-tubulin+ foci in EdU−/pH3− BMDCs. ****, P < 0.0001; **, P = 0.002 (unpaired Student’s t tests corrected for multiple comparisons after Holm-Sidak). Graph displays mean values ± SD of seven independent experiments. N = 134/98/158/93/124/344/274 cells (immature) and N = 141/203/158/127/128/200/175 cells (mature). Source data are available for this figure: SourceData FS2.

