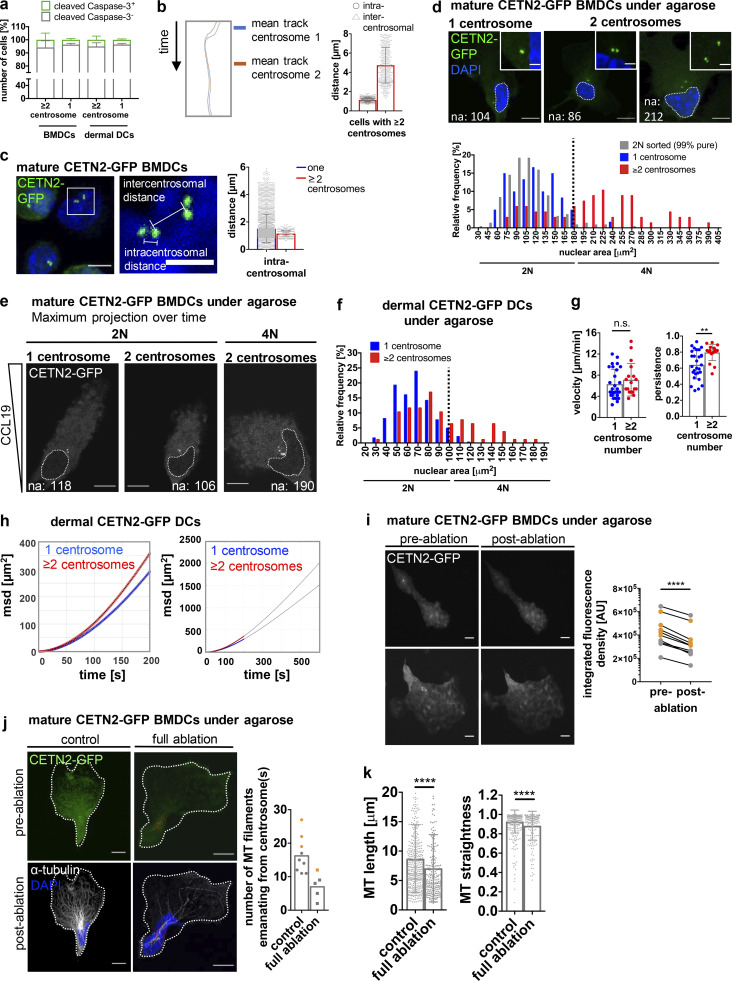
Figure S5.
Migration in the presence of multiple centrosomes. (a) Quantification of cleaved caspase-3–positive cells (green) in mature WT BMDCs and dermal DCs after immunostaining against cleaved caspase-3. Graph displays mean values ± SD of three independent experiments with N = 222/326/346 cells (BMDCs) and N = 357/150/268 cells (dermal DCs) analyzed. (b) Left: Centriole tracks of one representative cell with multiple centrosomes during migration. Right: Quantification of intra- and intercentrosomal distances in mature CETN2-GFP expressing BMDCs with multiple centrosomes during migration. (c) Left: Illustration of intra- and intercentrosomal distances in fixed mature CETN2-GFP expressing BMDCs. Middle: Magnification of boxed region. Right: Quantification of intracentrosomal distances in cells with one (blue) and multiple (red) centrosomes during migration. Scale bar, 5 µm. For b and c, cells were tracked either manually or automatically and distances determined as shown in c. N = 130 cells (one centrosome) and 12 cells (extra centrosomes) pooled from three independent experiments. (d) Upper panel: Nuclear areas (indicated by white dotted lines) of BMDCs with one and multiple centrosomes. Scale bars, 10 µm. Lower panel: Nuclear area distribution of mature CETN2-GFP expressing BMDCs with one (blue) and multiple (red) centrosome(s) as well as sorted 2N CETN2-GFP BMDCs (gray) fixed under agarose. Black dotted line indicates threshold for distinguishing 2N and 4N cells according to nuclear areas determined in sorted mature CETN2-GFP expressing 2N cells. N = 60/67/213 cells (one/multiple/2N) analyzed from two independent experiments. (e) Representative examples of nuclear areas in 2N and 4N CETN2-GFP expressing cells migrating under agarose. White dotted lines indicate nuclear areas. Centrioles are pseudo-color coded in gray. Scale bars, 10 µm. (f) Nuclear area distribution of CETN2-GFP expressing dermal DCs with one (blue) and multiple (red) centrosome(s). Black dotted line indicates threshold for distinguishing 2N and 4N cells. N = 216/76 cells (one/multiple) analyzed from two independent experiments. (g) Quantification of migration velocity (left) and persistence (right) of 2N dermal CETN2-GFP expressing DCs migrating under agarose. Graphs display mean values ± SD. N = 28 cells (one centrosome) and 18 cells (multiple centrosomes) pooled from four independent experiments. **, P = 0.0014 (two-tailed, unpaired Student’s t test [velocity] and two-tailed, unpaired Student’s t test with Welch’s correction [persistence]). (h) msd plots of dermal DCs migrating under agarose. Blue and red circles represent experimental data sets. Curves were fitted using Fürth’s formula (see Materials and methods section) and extrapolated for longer time periods (black lines; right panel). (i) Full laser ablations in mature CETN2-GFP expressing BMDCs migrating under agarose. Left: Maximum intensity Z-stack projection of two representative cells before and after laser ablation. Centrioles are pseudo-color coded in gray. Scale bars, 10 μm. Right: Quantification of integrated CETN2-GFP signal densities in defined ROIs drawn around centrosomes. Graph displays pairs of cells before (pre-) and after (post-) ablation. Cell pairs with one centrosome are depicted in gray, cell pairs with extra centrosomes in orange. N = 5/5 cells (one/multiple centrosomes). ****, P < 0.0001 (two-tailed, paired Student’s t test). (j) Left panel: Immunostaining against α-tubulin in cells migrating under agarose after complete centrosome and control ablation. Cells were fixed immediately after the ablation process. Individual and merged channels of CETN2-GFP (green) and α-tubulin/DAPI (white/blue) are shown. Images were post-treated by deconvolution. Red circles indicate ablated areas. White lines depict cell outline. Scale bars, 10 μm. Right panel: Quantification of MT filaments emanating from the centrosome in non- and fully ablated cells with one (gray) and multiple (orange) centrosomes. Graph displays mean values. Each data point represents one cell. (k) Quantification of MT length (left) and straightness (end-to-end distance/total length of MT filament; right) in non- and fully ablated cells. Graphs show mean values ± SD. N = 413/205 filaments traced from 9 or 5 different cells (non/full ablation). ****, P < 0.0001 (Mann-Whitney test). na, nuclear area.

