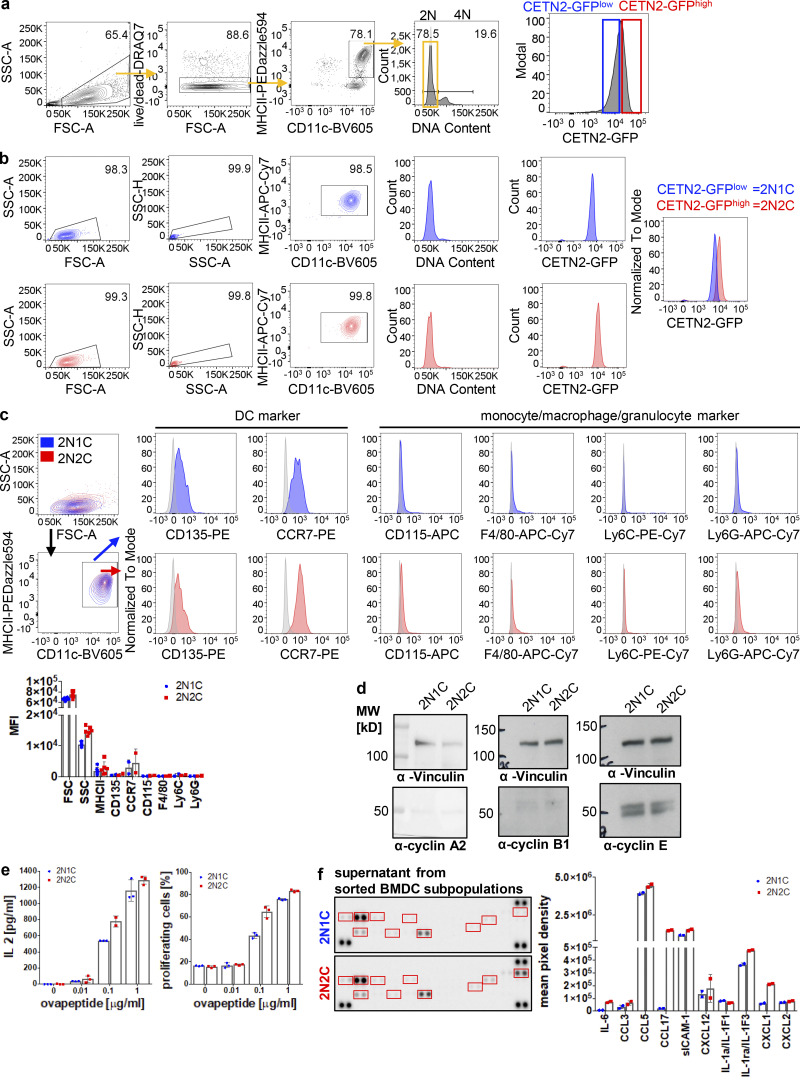
Figure S6.
Cells with extra centrosomes show enhanced T cell activation and cytokine secretion. (a) Separation of CETN2-GFPlow (blue) and CETN2-GFPhigh (red) expressing mature BMDCs. MHCII+/CD11c+ cells were gated on 2N and further separated according CETN2-GFP signal intensities. Black bars indicate gates for 2N and 4N cells. (b) Post-sort analysis of CETN2-GFPlow (2N1C) and CETN2-GFPhigh (2N2C) expressing cells for DNA content and CETN2-GFP signal intensities. (c) Cell-surface expression of DC, monocyte, macrophage, and granulocyte markers on enriched MHCII+/CD11c+ 2N1C and 2N2C subpopulations. Unstained controls were included in the histograms as gray filled lines. Representative histograms of one out of at least two independent experiments are shown. Graph below shows quantification of cell-surface markers indicated as mean fluorescence intensity (MFI). Mean values ± SD are depicted. (d) Immunoblotting of cyclins in sorted 2N1C and 2N2C BMDC subpopulations. One representative experiment out of three is shown. MW, mol wt. (e) Left: Quantification of IL-2 levels after co-culture of OVA-peptide-pulsed sorted 2N1C and 2N2C BMDC subpopulations with OT-II CD4+ T cells. Supernatants were analyzed for IL-2 by ELISA. Right: Quantification of OT-II CD4+ T cells that divided after co-culture with OVA-peptide-pulsed sorted 2N1C and 2N2C BMDC subpopulations. Graphs display mean values ± SD of one representative out of five (IL-2) and four (T cell proliferation) independent experiments. Data points represent technical replicates. (f) Cytokine array analysis of conditioned medium harvested from sorted 2N1C and 2N2C DC subpopulations. Sorted 2N1C and 2N2C cells were cultured and supernatants harvested after 16 h. Left: Cytokine array of supernatants harvested from 2N1C and 2N2C cells. Quantified cytokine signals are highlighted in red. Right: Quantification of cytokine signal intensities. Graph shows mean pixel intensities ± SD of one out of two independent experiments. Data points represent technical replicates. Source data are available for this figure: SourceData FS6.

