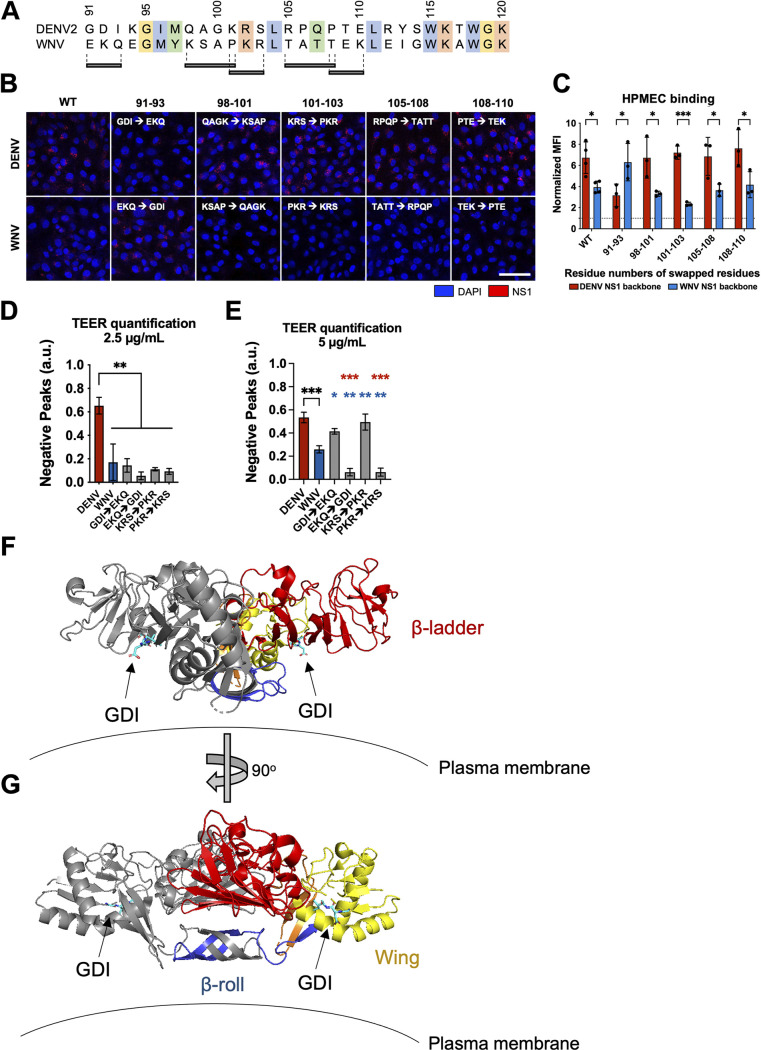
FIG 5.
Residues 91 to 93 of DENV NS1 drive DENV NS1–endothelial cell interactions. (A) Sequence alignment of DENV and WNV NS1 from amino acid residue 91 to 120, with black bars indicating the 3 to 4 residue motifs swapped in the site-directed mutants between DENV and WNV NS1. Colors of the residues indicate their similarities based on biochemical properties. (B) NS1 binding assay where 10 μg/mL of WT or mutant NS1 as indicated were added to HPMEC and imaged using immunofluorescence microscopy. (C) Quantification of (B). (D) HPMEC monolayer was seeded in the apical chamber of a Transwell and treated with either WT or site-directed mutant NS1 proteins at 2.5 μg/mL. Transendothelial electrical resistance (TEER) was measured over time, normalized to the untreated controls of respective time points. Area-under-the-curve (AUC) quantification of TEER curves is shown. (E) Same as (D) but treating with NS1 proteins at 5.0 μg/mL. AUC quantification of TEER curves is shown. (F, G) Dimeric DENV2 NS1 structure at 2.89 Å (PDB 7K93 [40]) was annotated to denote the location of the 91 to 93 GDI motif within the wing domain in spatial and structural reference to the rest of NS1. One monomer is colored gray while the other monomer is colored as follows: blue for β-roll, yellow for wing, red for β-ladder, and orange for interdomain connecting regions. Arrows point toward GDI motif on both monomers, colored in cyan. Plasma membrane is shown to indicate the position in which NS1 is proposed to interact. (F) and (G) are rotated 90° along the y axis from each other. All data are from at least 3 biological replicates, plotted as mean ± SEM. *, P < 0.05; **, P < 0.01; ***, P < 0.005; ****, P < 0.001 by one-way ANOVA with multiple comparisons. a.u., arbitrary units. Star colors indicate the respective control to which each construct has been compared.

