Fig. 6.
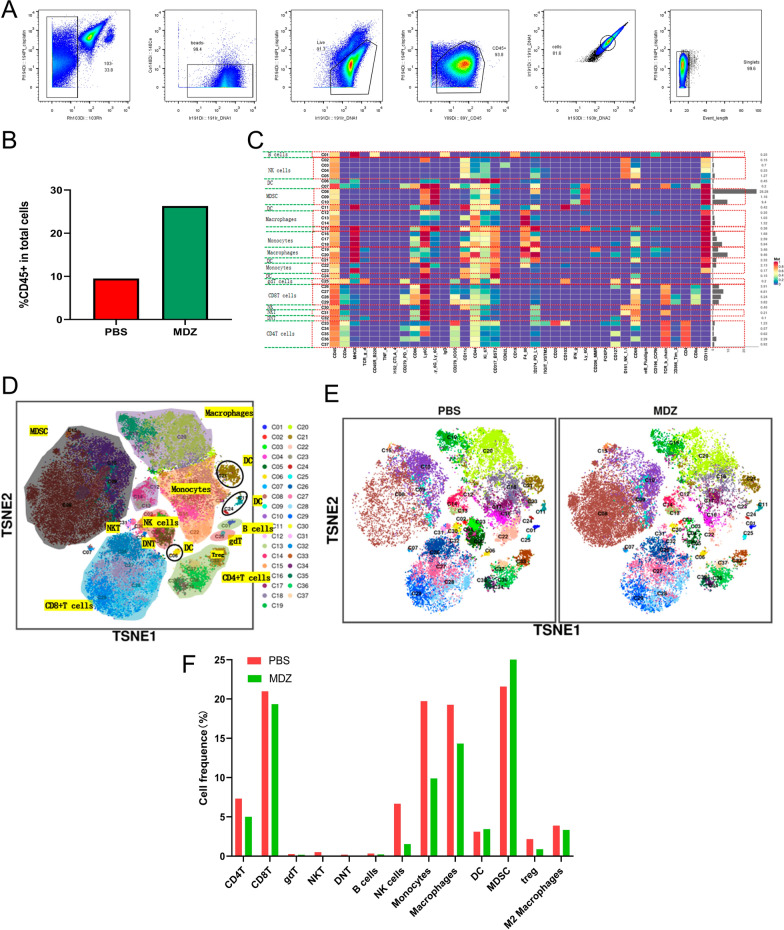
Mass cytometry was used to analyse the tumour immune microenvironment of subcutaneous HCC tumours after PBS/MDZ treatment. A The process of selecting CD45+ immune cells. B The proportions of CD45+ immune cells in different groups. C A total of 37 cell clusters were identified, and we defined the respective groups based on marker expression. D TSNE plot showing the distributions of 37 cell clusters. E The distribution of cell clusters in the indicated sample. F Histogram showing the number of the cell clusters in different groups by mass cytometry

