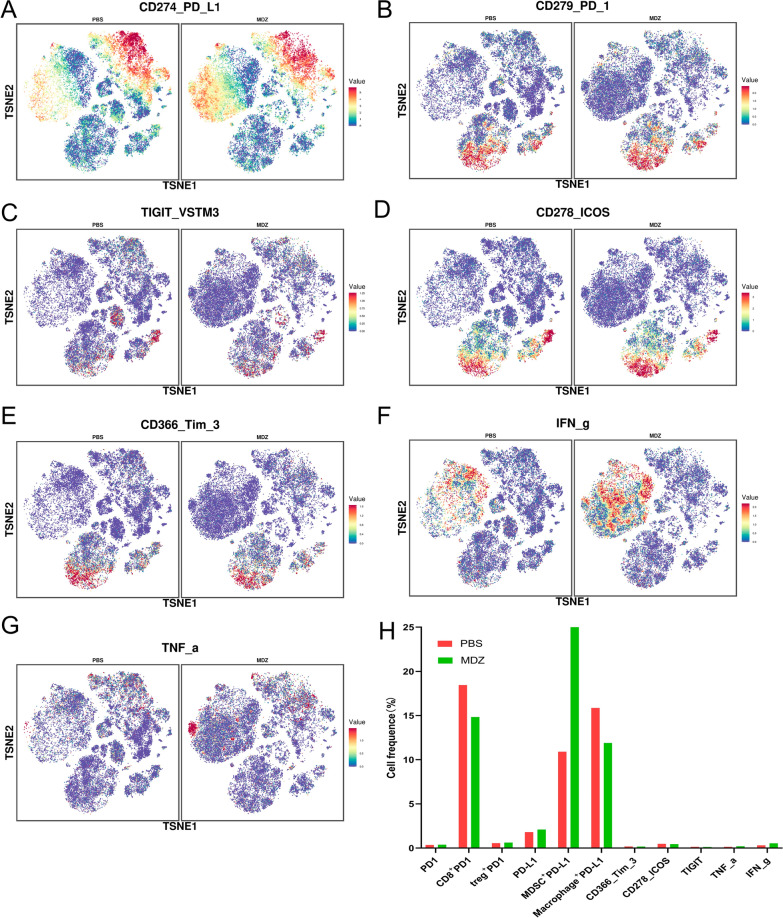
Fig. 7.
Mass cytometry revealed changes in marker expression after PBS/MDZ treatment. A–G TSNE plot showing the distribution of PD1, PD-L1, TIGIT, TIM3, ICOS, IFN-g and TNF-α expression in subcutaneous Hepa1-6 tumours in the PBS and MDZ groups. H The histogram shows the number of PD1+, CD8+PD1+, Treg+ PD1+, PD-L1+, MDSC+ PD-L1+, TIGIT, TIM3, ICOS, IFN-g+, and TNF-α+ cell clusters in the PBS and MDZ groups

