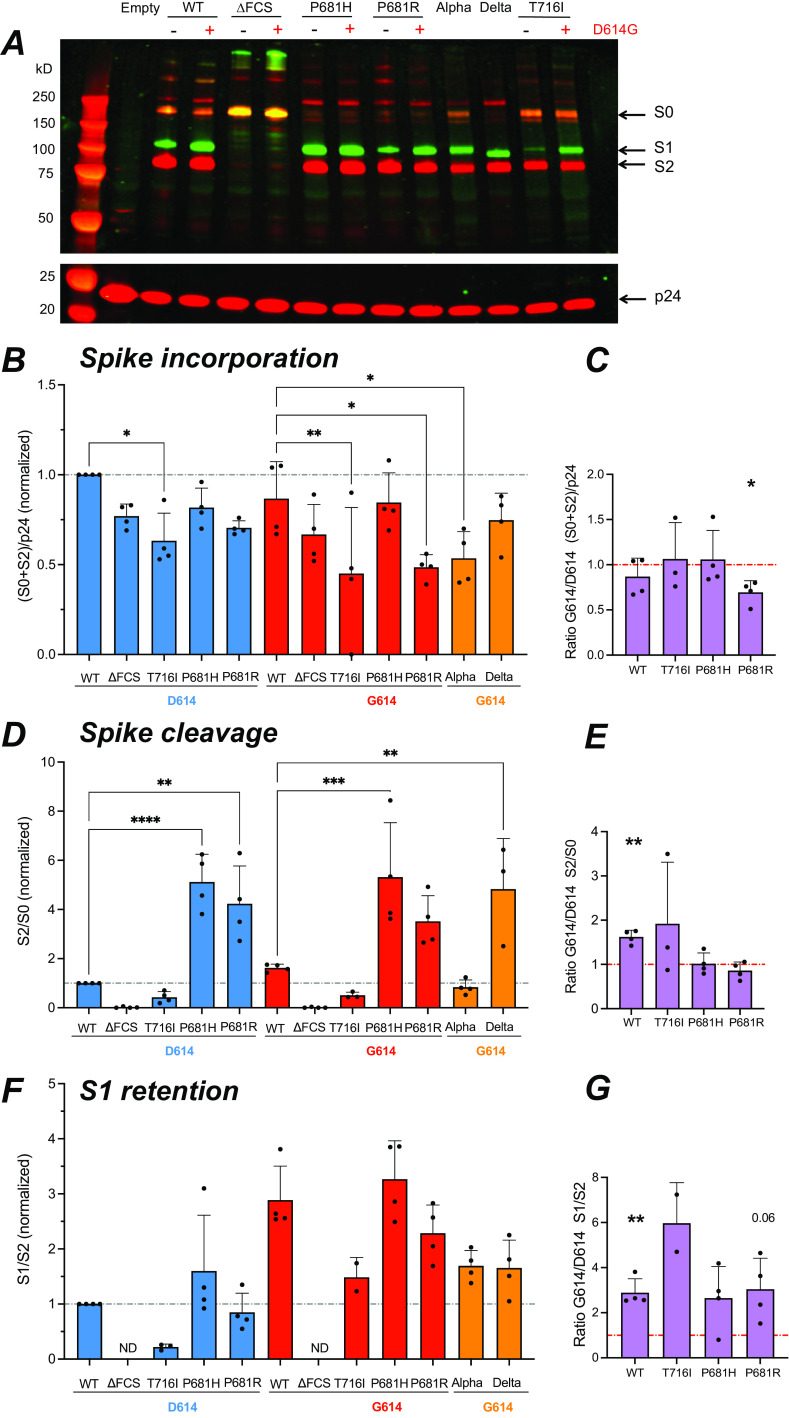
FIG 5.
The D614G mutation promotes S1 subunit retention in virions. The different forms of spike present into PV were analyzed by Western blotting on concentrated PV particles. (A) Representative Western blot showing the S1 (green) and S2 (red) spike subunits (top) and the p24 Gag protein (red) used for normalization (bottom). The equivalent of 300 ng p24 was loaded in each lane. Molecular weight markers were loaded in the first lane, with the expected marker size indicated on the left. The uncleaved spike precursor S0 is visible in yellow due to the superposition of green and red fluorescence. (B) Quantitation of total spike incorporated (S0 + S2), relative to p24 content, and normalized to the WT value. The fluorescence intensity of each band was quantified with the Image Studio Lite software. (C) Ratio of total spike incorporated measured in the G614 backbone to that in the D614 backbone. (D) Quantitation of total cleaved spike, measured by the S2/S0 ratio and normalized to the WT value. (E) Ratio of total cleaved spike measured in the G614 backbone to that in the D614 backbone. (F) Quantitation of S1 subunit retention in PV particles, measured by the S1/S2 ratio, and normalized to the WT value. ND, not detectable. (G) Ratio of S1 retention in the G614 backbone to that in the D614 backbone. (B, D, and F) Statistics were measured by one-way ANOVA, with the Holm-Šidák correction for multiple comparisons. D614 backbone mutants were compared to the WT D614 spike, while G614 backbone mutants were compared to the WT G614 spike. (C, E, and G) Statistics evaluating whether each ratio was different from 1 were measured by one-sample t tests. (B to G) Means and SD are shown for ≥3 independent experiments, except for T716I S1 retention, where n = 2. *, P < 0.05; **, P < 0.01; ***, P < 0.001; ****, P < 0.0001.

