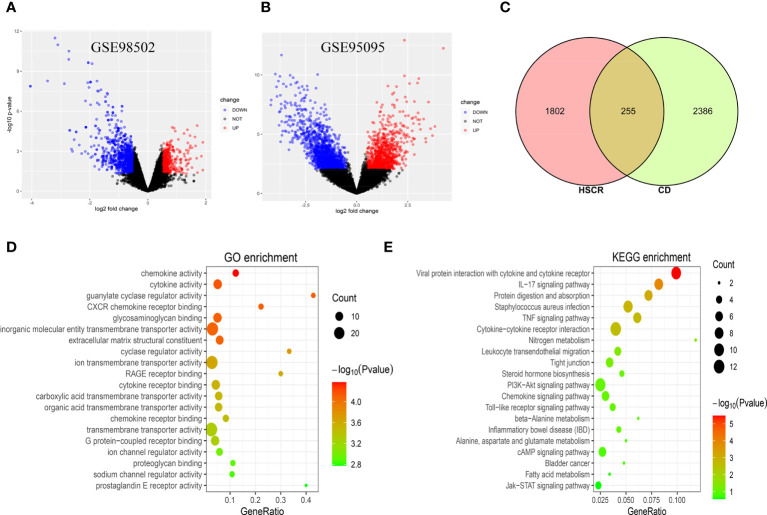
Figure 2.
(A) The volcano map of GSE98502. (B) The volcano map of GSE95095. Upregulated genes are marked in red; downregulated genes are marked in blue. (C) The two datasets showed an overlap of 255 DEGs. (D, E) The enrichment analysis results of GO and KEGG pathway. DEGs, differentially expressed genes; GO, Gene Ontology; KEGG, Kyoto Encyclopedia of Genes and Genomes.

