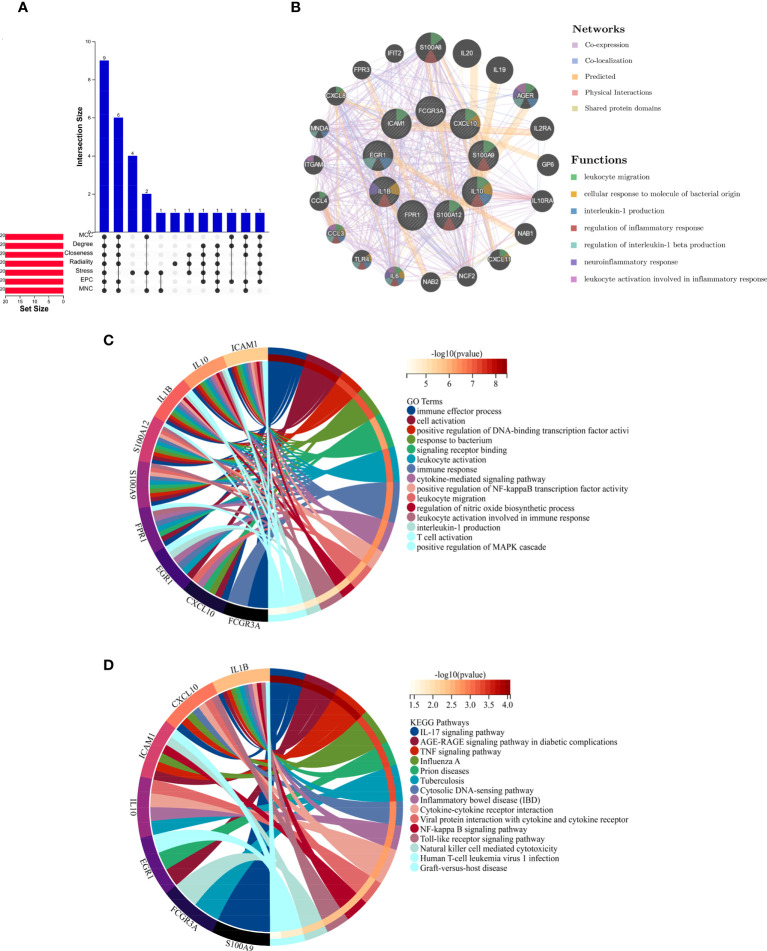
Figure 4.
(A) The Venn diagram shows that seven algorithms have screened out nine overlapping hub genes. (B) Hub genes and their co-expression genes were analyzed via GeneMANIA. (C, D) GO and KEGG enrichment analyses of the hub genes. The outermost circle is term on the right, and the inner circle on the left represents the significant p-value of the corresponding pathway of the gene. GO, Gene Ontology; KEGG, Kyoto Encyclopedia of Genes and Genomes.

