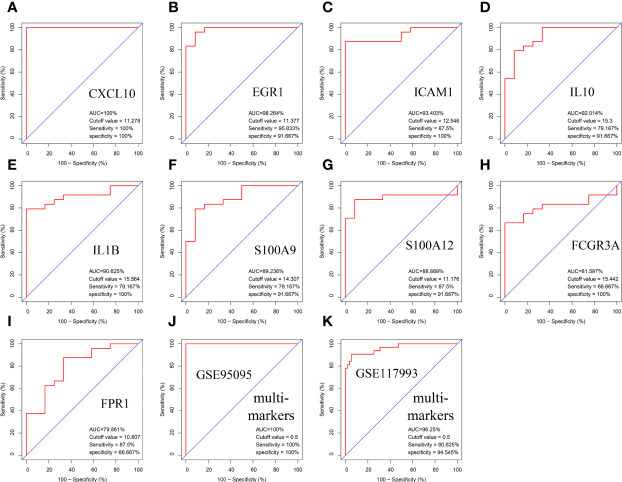
Figure 7.
Validation of hub genes in the diagnostic value. (A–I) Validation of hub genes in the GSE95095. ROC curves and AUC statistics are used to evaluate the capacity to discriminate CD from healthy controls with excellent sensitivity and specificity. (J) Validation of the integrated diagnostic model in the GSE95095. (K) Validation of the integrated diagnostic model in the GSE117993. These findings indicated these nine hubgenes have excellent diagnostic efficiency in CD. ROC, receiver operating characteristic; AUC, area under the curve; CD, Crohn’s disease.

