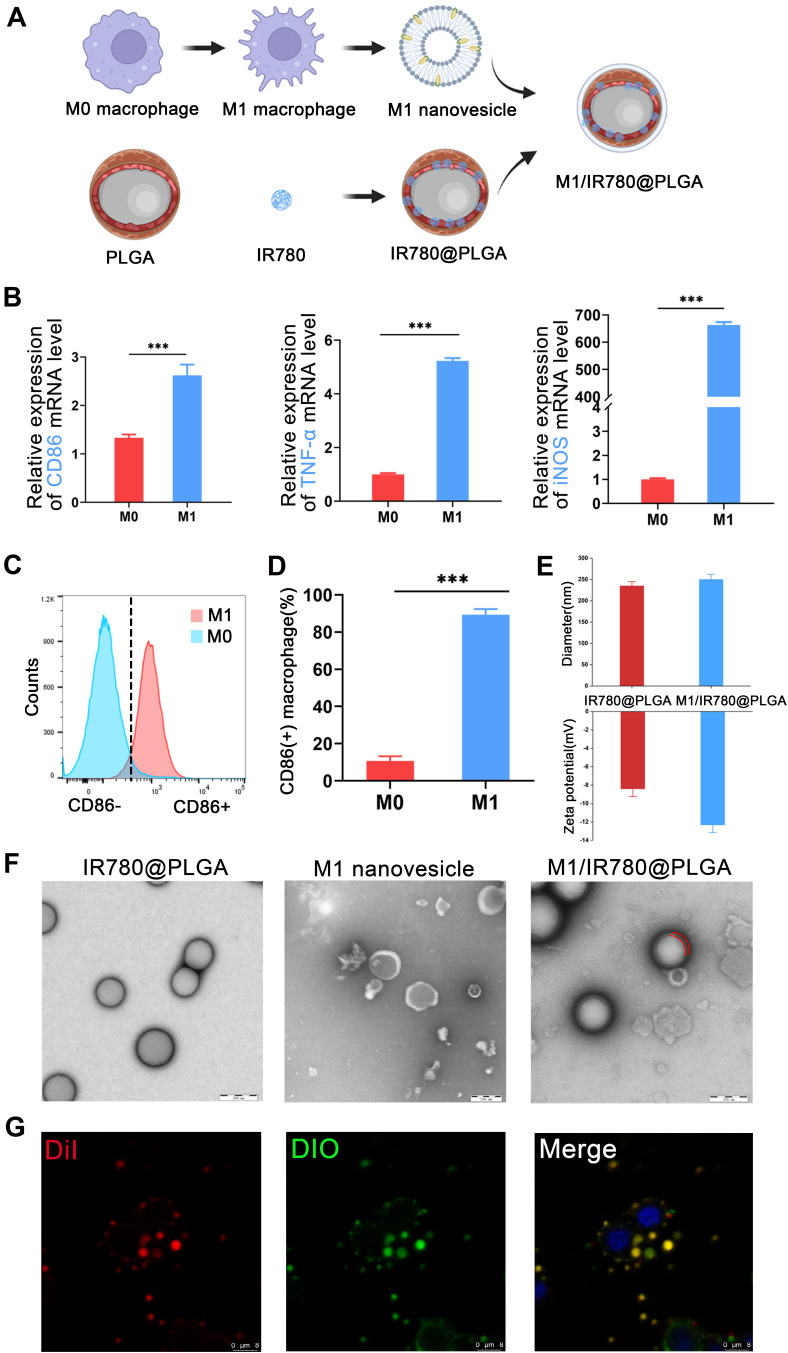
Figure 1.
Characterization of M1/IR780@PLGA nanoparticles. (A) Schematic illustration of the preparation of M1/IR780@PLGA nanoparticles. (B) Induction of macrophage switching from M0 to M1 by LPS, RNA expression levels of CD86, TNF-α and iNOS in macrophages determined by quantitative real-time polymerase chain reaction. (C and D) Definition of M1 polarized macrophages by flow cytometry (C) and quantification results (D). (E) Size and zeta distributions of IR780@PLGA nanoparticles and M1/IR780@PLGA nanoparticles. (F) The TEM image of IR780@PLGA nanoparticles, M1 nanovesicles and M2/IR780@PLGA nanoparticles (Scale bar: 100 nm). (G) Typical confocal images of RAW264.7 incubated with M1/IR780@PLGA nanoparticles, DiI-labeled IR780@PLGA nanoparticles (red) and DiO-labeled M1 nanovesicle (green). Scale bar, 10 µm. Statistical significances were calculated via Student’s t-test, ***P < 0.001.

