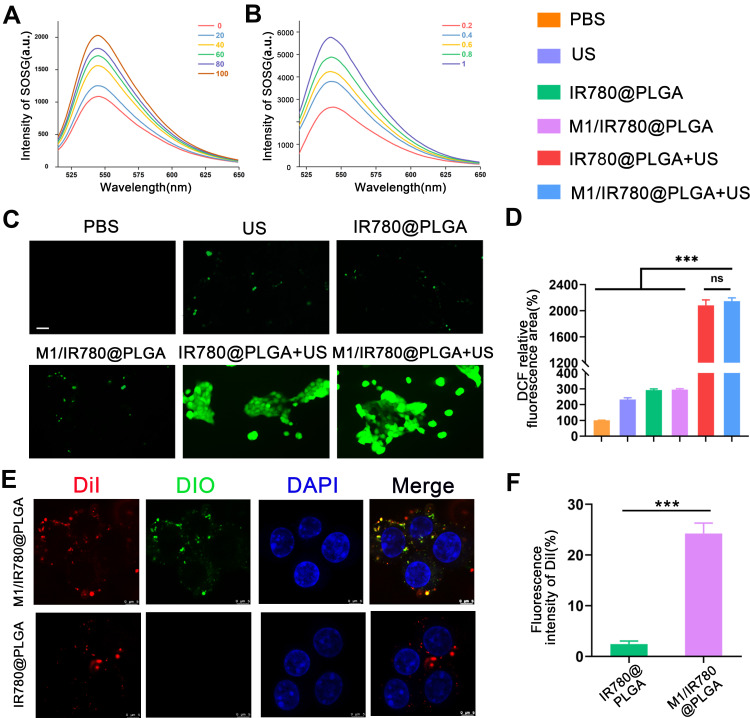
Figure 2.
(A) Time-dependent ROS generation of M1/IR780@PLGA nanoparticles detected by SOSG at a fixed IR780 concentration of 0.05 mg/mL for 0, 20, 40, 60, 80 and 100s. (B) Concentration-dependent ROS generation of M1/IR780@PLGA nanoparticles (0.2, 0.4, 0.6, 0.8 and 1.0 mg/mL) detected by SOSG. (C) Intracellular ROS generation after different treatments visualized by fluorescence microscope and (D) quantitative analysis of fluorescence area. Scale bar 50 µm. Statistical significances were calculated via one-way ANOVA, ***P < 0.001, ns means no statistical significance. (E) CLSM images of intracellular uptake of M1/IR780@PLGA nanoparticles and IR780@PLGA nanoparticles by 4T1 cells and (F) quantitative analysis of fluorescence intensity. DiI-labeled IR780@PLGA nanoparticles showed red fluorescence, DiO-labeled M1 nanovesicles showed green fluorescence and DAPI-labeled nucleus showed blue fluorescence. Scale bar 5 µm.

