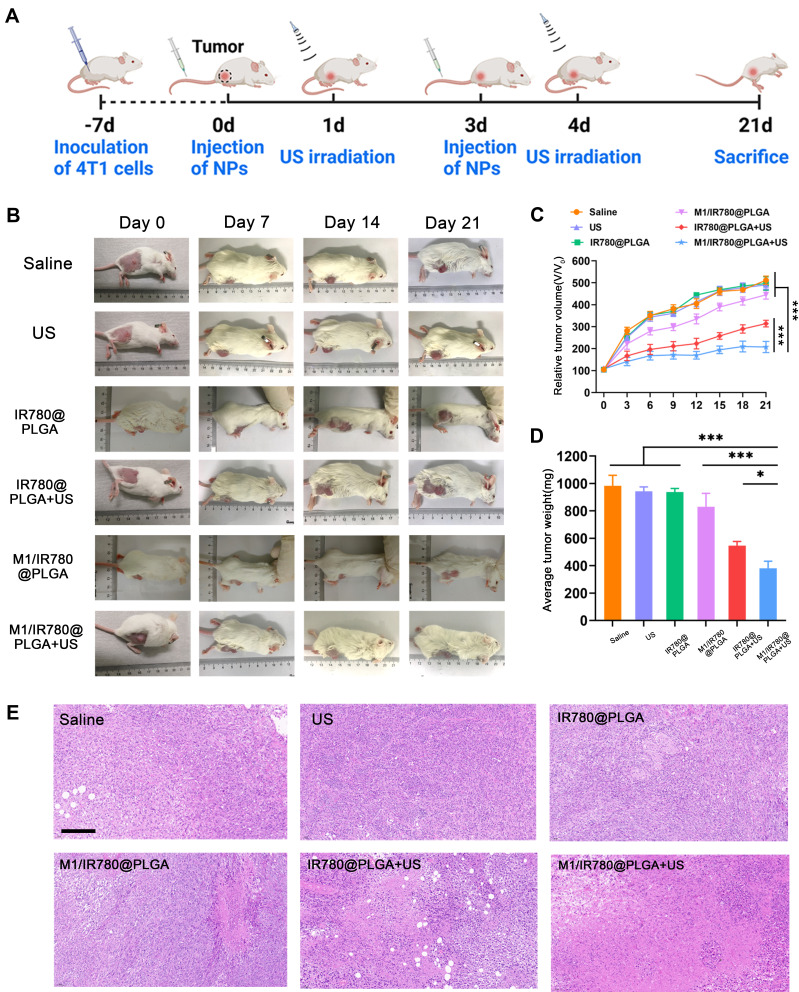
Figure 5.
The antitumor effect of M1/IR780@PLGA nanoparticles. (A) Schematic illustration of the time schedule for in vivo treatment of tumor-bearing mice. (B) The photographs of tumor-bearing mice before and after different treatments at 7, 14 and 21 days. (C) Tumor growth curve and (D) average tumor weight of mice after different treatments. Data are expressed as means SD (n = 5). Statistical significances were calculated via one-way ANOVA, *P < 0.05, ***P < 0.001. (E) H&E staining of tumor tissue slices after different treatments, scale bar = 100 μm.

