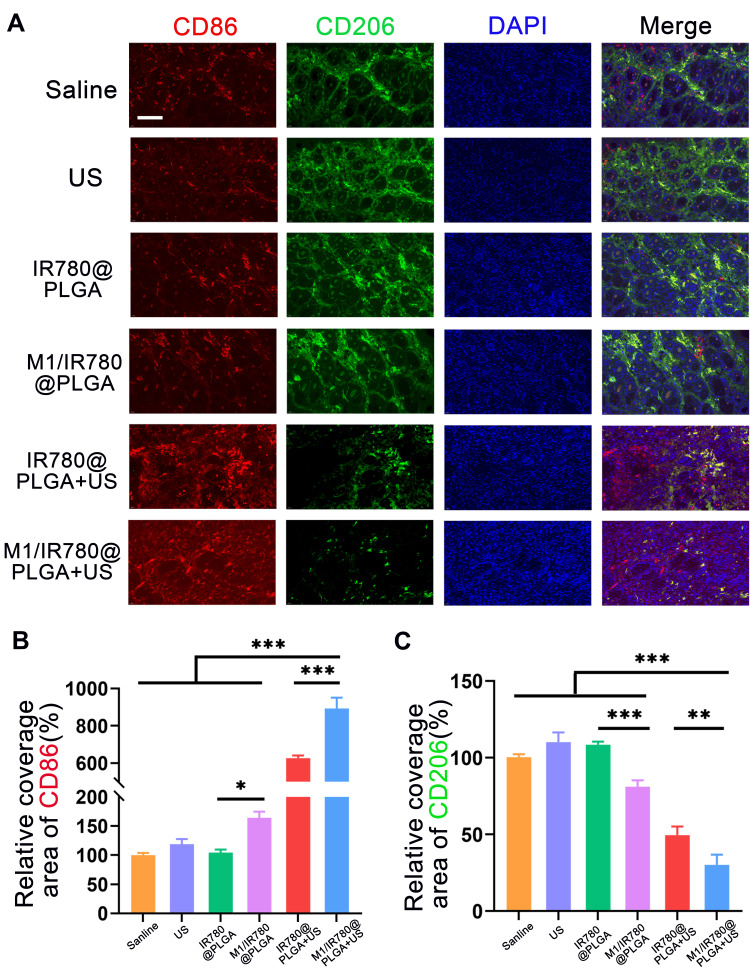
Figure 6.
The immunofluorescence analysis. (A) Representative immunofluorescence images showing CD86 and CD206 in different groups. Scale bar: 100 μm. (B) The relative quantification of CD86 and (C) CD206 after different treatments. Data are expressed as means SD (n = 5). Statistical significances were calculated via one-way ANOVA, * P < 0.05, **P < 0.01, ***P < 0.001.

