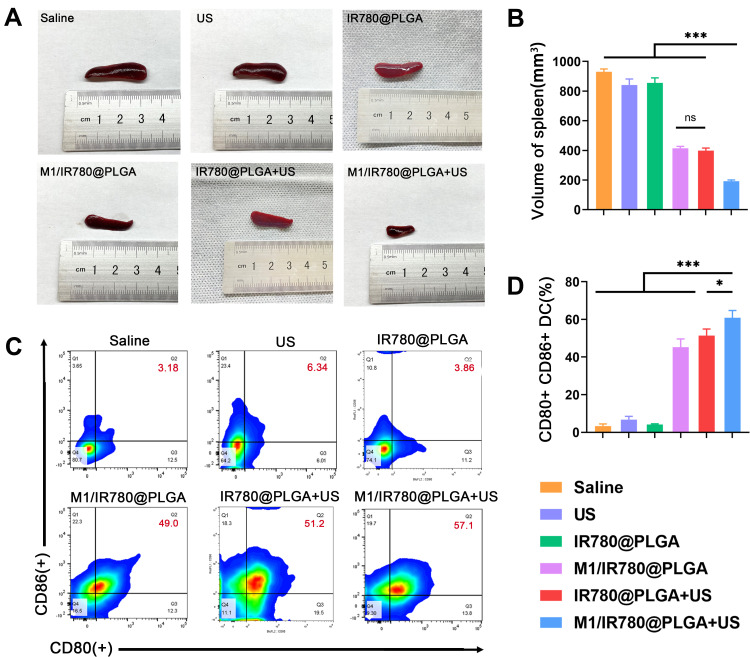
Figure 7.
(A) General photographs and (B) volume of spleens obtained from mice in different treatment groups. (C) Quantification of CD80 and CD86 expression and (D) representative FACS plots on dendritic cells gated by CD11c+ cells. Data are expressed as means SD (n = 5). Statistical significances were calculated via one-way ANOVA, * P < 0.05, ***P < 0.001, ns means no statistical significance.

